Figures & data
Table 1. Number of procedures (%) performed on patients in the different age groups
Table 2. The most common stems and implant heads in the different groups
Table 3. ASA grade and classification of cognitive impairment 2008–2010 (number of procedures (%))
Table 4. Number (%) of reoperations and revisions in different categories
Table 5. Numbers and causes of reoperations and revisions
Figure. Proportion not reoperated
Survival analysis (Kaplan-Meier) regarding reoperation for patients treated with unipolar and bipolar hemiarthroplasties, with 95% confidence intervals.
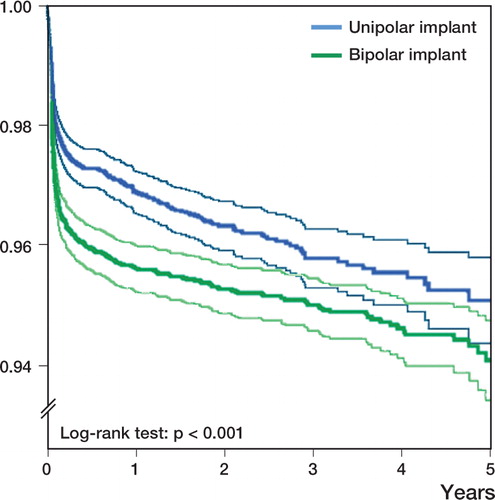
Table 6. Hazard ratios (Cox regression analysis) with 95% CIs for reoperation generally and for specific reasons
Table 7. Number of patients (%) who had died at 1 year postoperatively and at the end of the study period (n = 22,642)
Table 8. Hazard ratios (Cox regression analysis) with 95% CI for mortality during the first postoperative year, including patients operated from 2008 through 2010 (valid number of patients in the analysis = 9,679)