Figures & data
Figure 1. PRISMA flow chart of both reviews. Details of the 28 PFI combinations are given in Table 1. RSA: radiostereometric analysis; TKP: total knee prosthesis; FU: follow-up; PFI: prosthesis-fixation-insert combination.
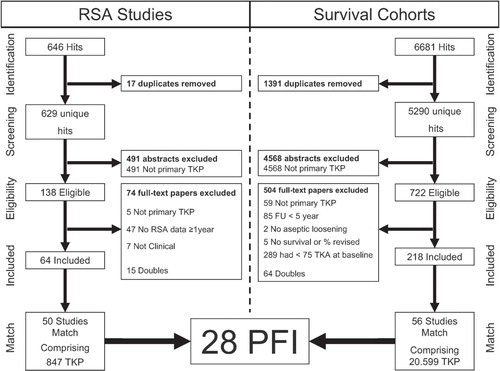
Table 1. Prosthesis, Fixation and Insert (PFI) characteristics.
Figure 2. Scatter plot showing association between migration in the first postoperative year expressed as maximal total point motion (MTPM) in mm and revision rate for aseptic loosening of the tibial component at 5 years, as a percentage. The colored lines are derived from weighted regression according to match quality, survival study quality, and RSA study quality (the coefficients and 95% CI are given in Table 2).
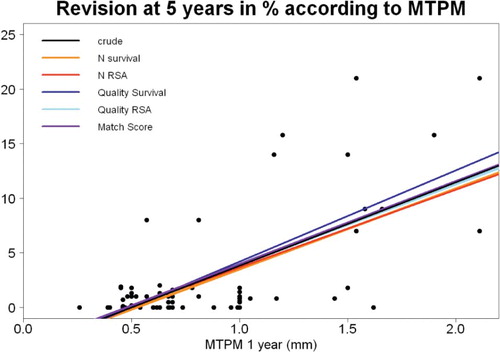
Table 2. Association between MTPM at 1 year and revision rate for aseptic loosening at 5 years
Figure 3. Scatter plot showing the relation between MTPM at 1 year and revision of the tibial component for aseptic loosening at 5 years. The thresholds of 0.54 mm and 1.6 mm for the three categories (acceptable, at risk, and unacceptable) are shown.
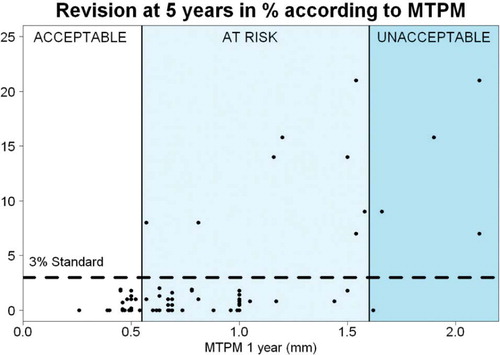
Figure 4. Scatter plot showing the relation between MTPM at 1 year and revision of the tibial component for aseptic loosening at 10 years. The thresholds of 0.45 mm and 1.6 mm for the three categories (acceptable, at risk, and unacceptable) are shown.
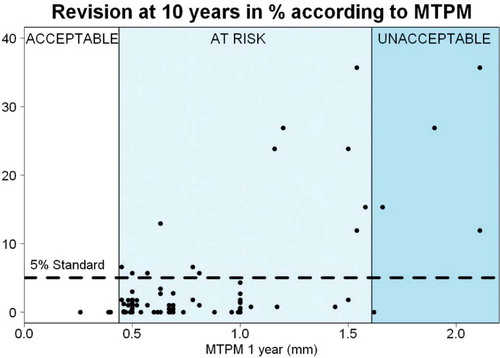
Figure 5. Dot chart showing the pooled MTPM ranked by the pooled revision rate for each PFI combination. The acceptable PFI combinations (based on migration) had excellent track records and low revision rates in several national registries, whereas the unacceptable PFI combinations (based on migration) have been abandoned. Thus, the potential influence of publication bias on the results is small. A detailed description of each PFI combination is given in Table 1. R5(%): pooled revision rate at 5-year follow-up, as a percentage.
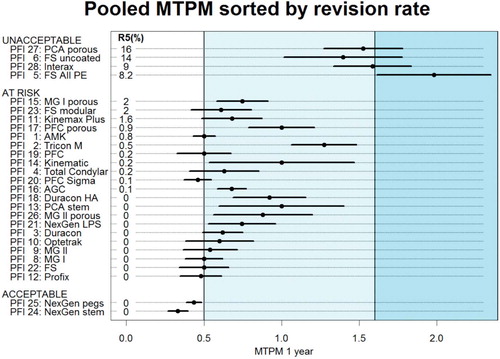
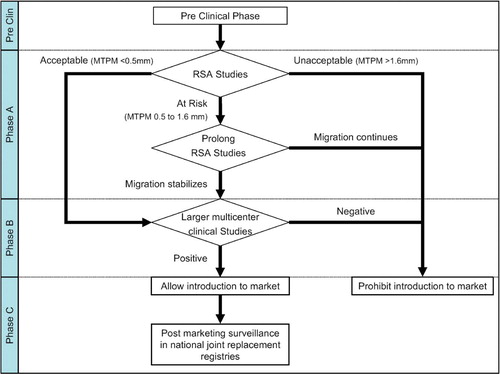
Figure 6. Flow chart showing the role of RSA studies in the phased evidence-based introduction of new TKPs, modified according the Malchau proposal. Stabilization is defined as migration of less than 0.2 mm in the second postoperative year (MTPM from year 1 to year 2) as described by CitationRyd et al. (1995). See discussion for details of each phase.