Figures & data
Table 1. Demographic data. Values are median (range)
Consort flow diagram of 24 bilateral total knee replacements randomized in the study (n = 48 total knee replacements).
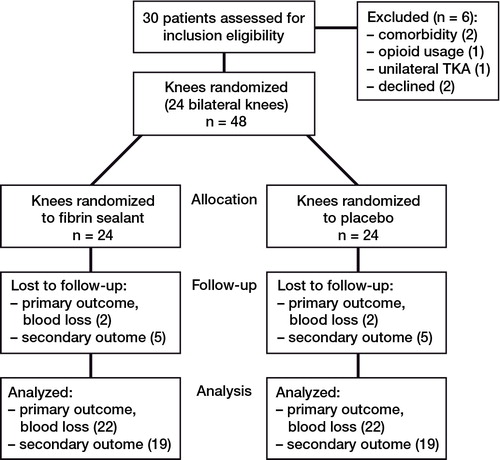
Table 2. Swelling in 19 patients (circumference (cm), postoperative strength (Nm/kg), ROM (degrees), and pain (VAS))