Figures & data
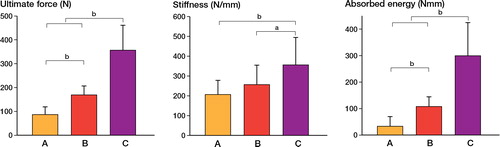
Figure 1. The region of interest (ROI) for each bone was determined by first identifying the fracture line (dashed line) and then defining a region approximately 3 mm (150 images) proximal and distal to the fracture line (solid lines) (panel A). Within the defined ROI, semi-automatic segmentation was used on each 2D image to identify the circumferential boundaries of the calluses (panel B).
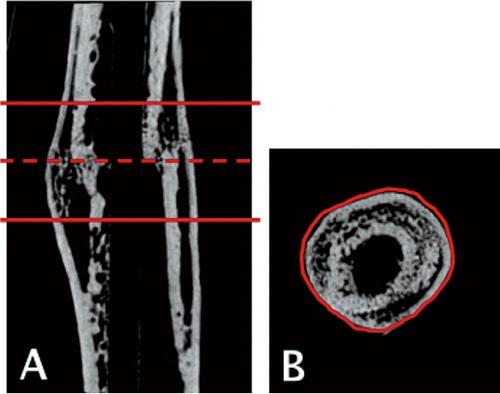
Figure 2. Radiographs of the median samples from each group (based on callus volume) after harvest at 6 weeks.
A. Group A (autograft group) with fracture line still visible.
B. Group B (autograft + BMP) showing larger calluses than in group A.
C. Group C (autograft + BMP + zoledronate) showing an even larger callus and a denser appearance, reflecting increased BMD.
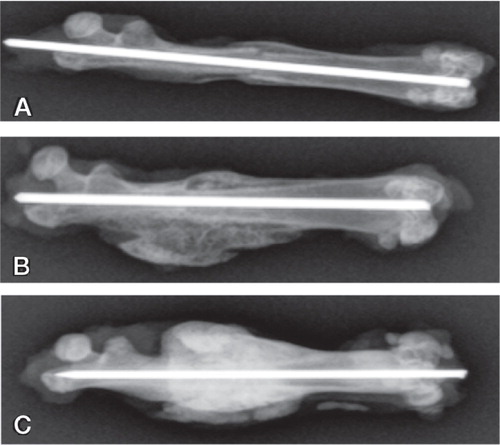
Figure 3. Micro-CT rendered image of median samples from each group (based on callus volume). A. Autograft. B. Autograft + BMP. (C) Autograft + BMP + zoledronate.
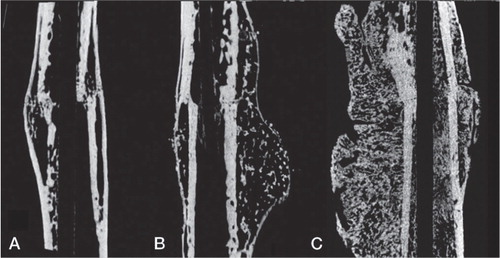
Table 1. Bone callus measurements based on microCT. Total callus volume (TVc), highly and lowly mineralized bone volume (BVhigh, BVlow), bone volume fraction (BVhigh / TVc) and tissue mineral density (TMD) were calculated. Mean and standard deviation (SD) are given, as well as statistical significant differences based on Kruskal-Wallis post hoc test (a p<0.05, b p<0.01, c p<0.001 compared to group A; d p<0.01 compared to group B). ABG stands for saline treated bone graft
Table 2. Mechanical testing outcome for experimental (osteotomized) and the control (contralateral non-fractured) femurs. Based on three-point bending, the ultimate force, stiffness and absorbed energy were calculated. The percentage differences (Diff.) and the statistical differences between the experimental and control side (Wilcoxon signed rank test) are given
Figure 4. Mechanical testing data from the experimental (osteotomized) femurs in Group A, B, and C (see Figure 2). Mean and standard deviation (SD) are given for ultimate force (left panel), bending stiffness (middle panel), and absorbed energy (right panel). Statistically significant differences, based on Kruskal-Wallis post hoc test, are indicated ( a p < 0.05, b p < 0.001).