Figures & data
Figure 1. Preoperative planning screen. The tumor has been colored, to discern it more easily during the operation. The resection planes have been planned using the coronal, axial, and sagittal view. These planes are copied to the pre-matched CT of the donor bone.
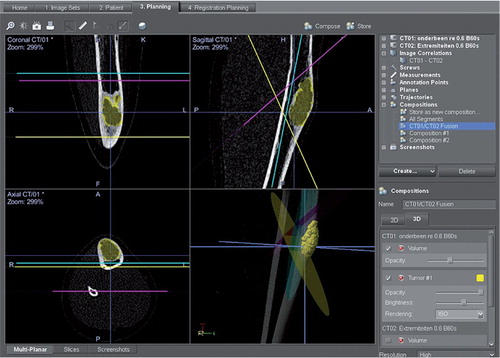
Figure 2. Tracker on the allograft tibia.
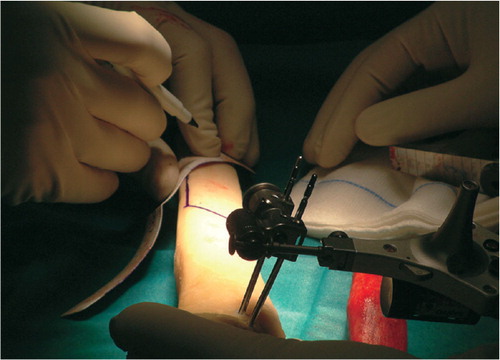
Figure 3. Radiographic series of the first patient. A. OFD-like AD lesion in situ. B. Immediately postoperatively. The graft and the host resection planes are both smooth and in close proximity. The distal point of the host bone has a small defect, most probably created by the vibrations of the saw blade. The remaining gap is filled with Vitoss (Orthovita Inc., Malvern, PA). C. Progressive ingrowth after 5 months. Cortical hypertrophy is clearly visible. D. Full integration and almost entirely faded boundary line at 16 months.
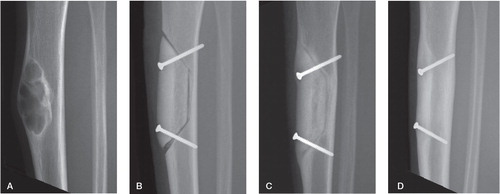
Figure 4. Graph of the post operative CT scan of the fourth patient. Average gap was 0.9 mm (range 0–5.4). The sharp increase of the medial gap is due to an angulation error during resection.
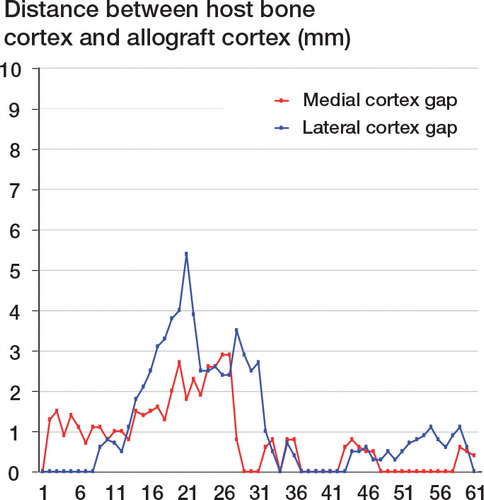
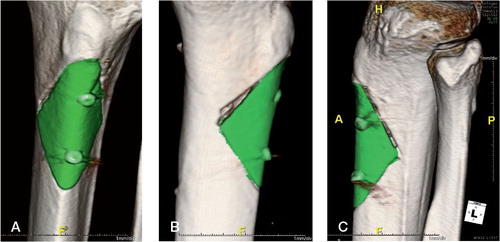
Figure 5. 3D rendered images made with iNtution (TeraRecon). The allograft is auto-segmented and colored green. The medial view shows the defect caused by an angulation misalignment in the last stage of the proximal resection plane. A. Medial view. 2 distinct resection cuts are visible. B. Anterior-posterior view. C. Lateral view.