Figures & data
Table 1. Demographic baseline data for all patients included (n = 18)
Table 2. Results of F-wave studies in the operated leg and median of the differences between the unoperated and the operated leg on day 3 and 2 months postoperatively
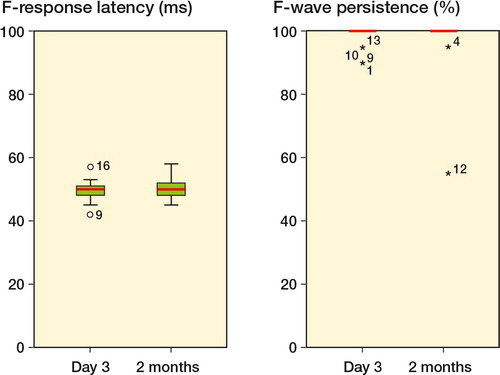
Figure 1. F-wave latency (in ms) and F-wave persistence (%) in the peroneal nerve in the operated leg both at day 3 and 2 months postoperatively. Patient no. 16 had EMG-confirmed nerve injury and the highest cuff pressure of 294 mmHg.
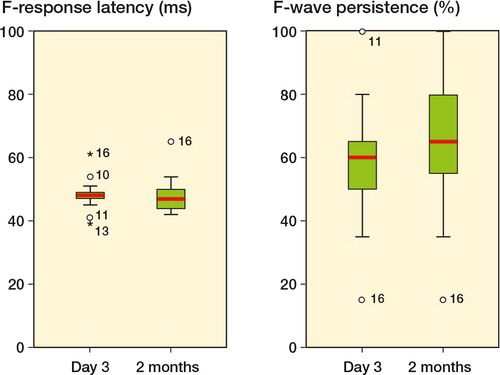
Figure 2. F-wave latency (in ms) and F-wave persistence (%) in the tibial nerve in the operated leg both at day 3 and 2 months postoperatively. Patient no. 16 had EMG-confirmed nerve injury and the highest cuff pressure of 294 mmHg. Patient no. 12 had the longest bloodless field duration of 122 minutes.