Figures & data
Figure 1. CONSORT Flow chart showing the inclusion and analysis process of the RCT.
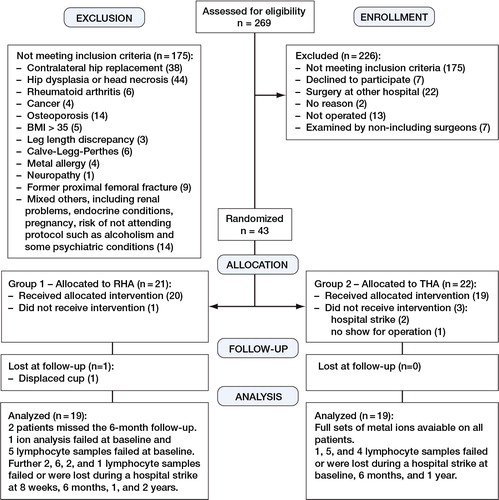
Table 1. Baseline demographic data expressed as median (range)
Figure 2. Box plot depicting median, lower and upper quartiles (box). Whiskers mark the adjacent values and dots represent the outliers.
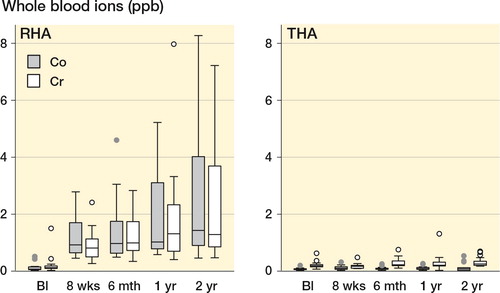
Table 2. Mean values (SD) of functional parameters at 2 years. None were considered failures. The numbers in the group > 7 ppb were too low for meaningful testing of statistical significance
Table 3. Details of lymphocyte counts at each follow–up time, reported as median values 95%CI and range. Development of lymphocyte and subgroup counts are reported separately for RHA and THA together with the mean 95% CI difference between the groups. The linear regression analysis was adjusted for gender and baseline values, and repeated measures were accounted for by the Cluster option in STATA. The lymphocyte change/year is reported as mean 95% CI, and in the analysis between THA and RHA a negative mean change/year indicates that the decline in lymphocytes was greater for RHA
Table 4. Regression analysis of RHA and THA combined between ion level and change in lymphocytes, with regression coefficients measured as ×109 cells/L/ppb. Dependent variable: change in T–cell levels from baseline to the time given; independent variable: metal ion concentration at the time given. ANCOVA adjusted for baseline values of T–cells and for gender