Figures & data
Figure 1. Annual number of TERs over time.
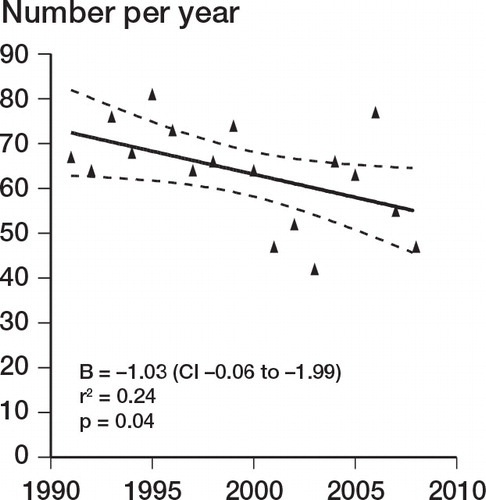
Figure 2. Change in incidence over time for TERs carried out for rheumatoid arthritis.
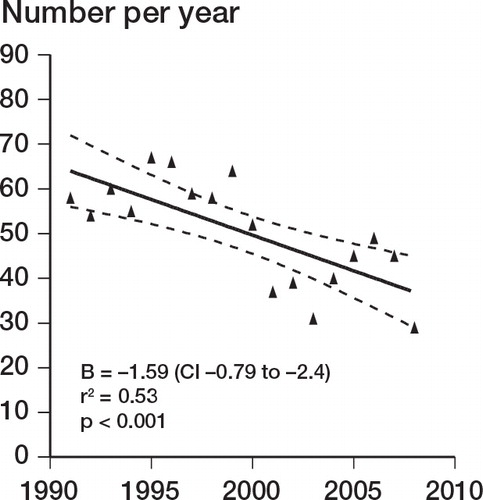
Figure 3. Change in prevalence versus time for TER performed for non-inflammatory conditions
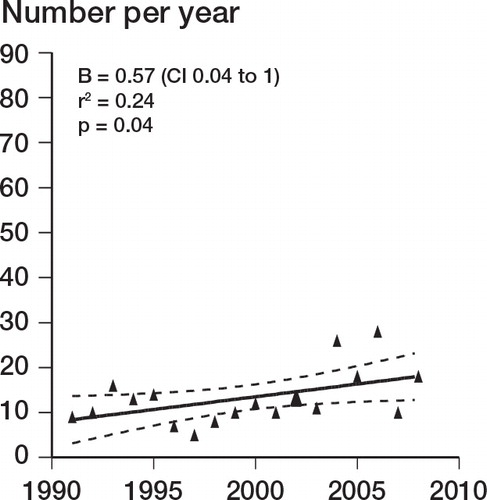
Table 1. Implant survivorship (Kaplan-Meier) with revision as endpoint, by number of procedures per surgeon per year, diagnosis, and age
Figure 4. Overall Kaplan-Meier survivorship with revision as endpoint. Bars represent CI.
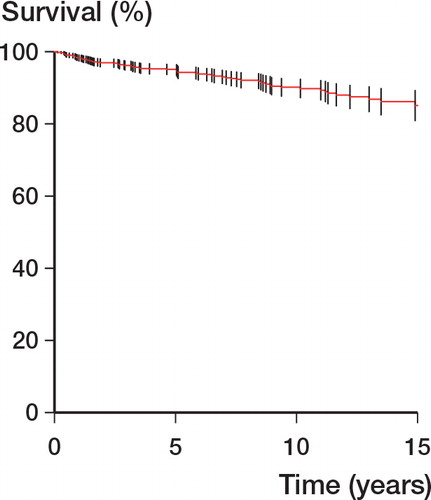
Table 2. Early complication rates
Table 3. Cumulative complication rate by annual surgeon volume
Table 4. Primary diagnosis by annual surgeon volume