Figures & data
Figure 1. Digital virtual plan of the operation to be performed, and actual postoperative radiographs.
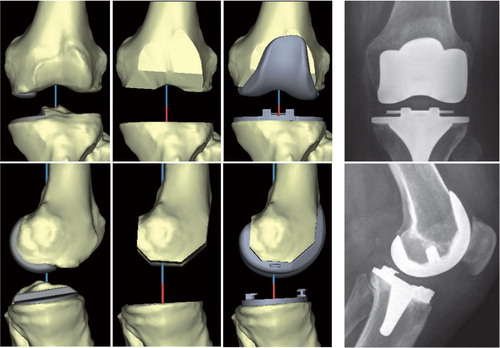
Figure 2. Single-way fitting position of guides on the patient’s individual anatomy.
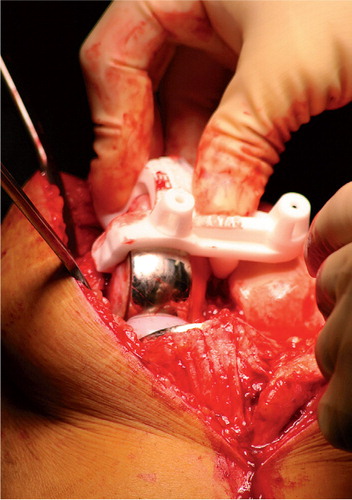
Figure 3. Illustration showing that there was no contact between either the cartilage of the lateral femoral condyle or the lateral tibial plateau and the guide.
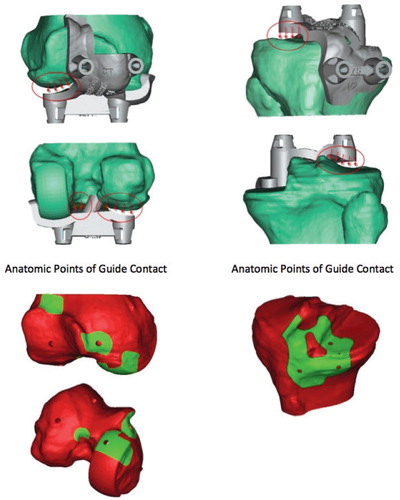
Figure 4. Repositioning of the guide after removal of the prosthesis using the three predrilled holes and insertion of the fourth pin.
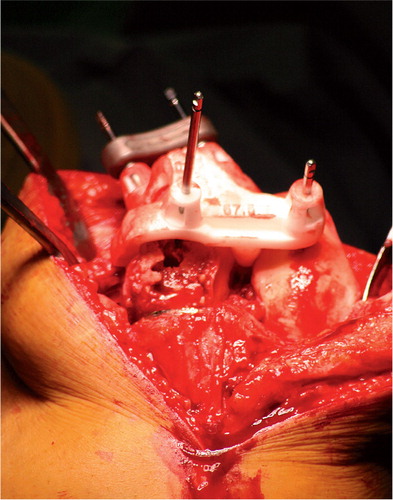
Figure 5. Pins were used to position the femoral cutting blocks to make bone resections for the new TKA.
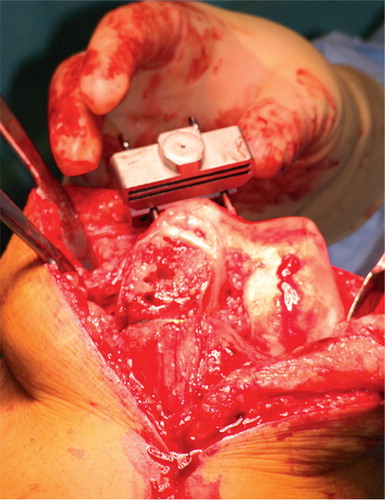
Table 1. Intra-assessor and inter-assessor intra-class correlation coefficients (ICCs) per measured angle
Figure 6. Preoperative planning shows that the medial anterior pin (blue line marked and red arrow) cannot be drilled into bone in a stable way.
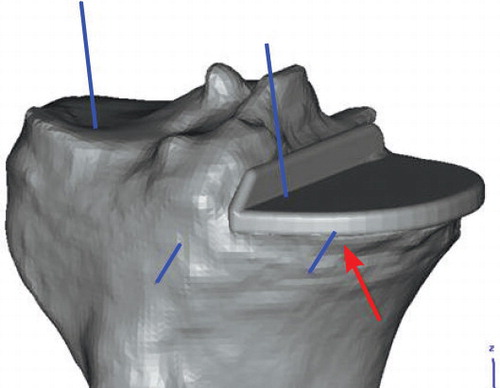
Table 2. Hip-knee-ankle (HKA) angle, varus/valgus position of the tibial and femoral components (tibia AP and femur AP), and flexion/extension of the tibial and femoral components (tibia sagittal and femur sagittal). Positive values indicate varus, posterior tibial slope, and femoral component flexion. Negative values indicate valgus, anterior tibial slope, and femoral component extension. Outliers are defined as being more than 3° from the desired position and numbers of outliers are shown depending on the extent of being more than 3° from the ideal position