Figures & data
Figure 1. The BetaCone stem (left) and the SL-PLUS stem (right).
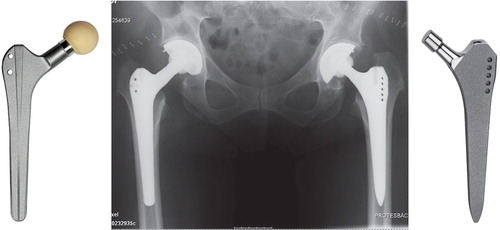
Figure 2. From left to right: CT-, F-PET-, and combined PET/CT-images of pelvis and hips 4 months after surgery. BetaCone stem in the right hip and SL-PLUS in the left hip. Blue color indicates low activity and white color indicates high activity.
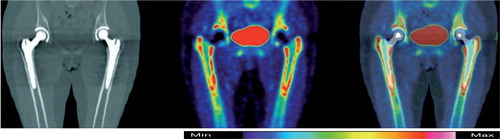
Figure 3. The upper femur treated as a cylinder, folded out so that it becomes a disc named a Polar Map. Each of the 7 Gruen zones represents 1 ROI in the disc; 6 other ventral or dorsal ROIs complete all the regions adjacent to the stem.
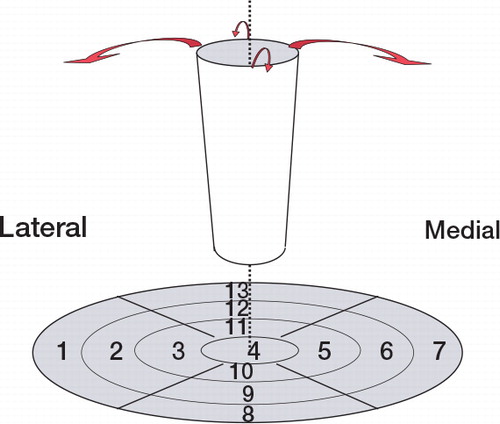
Table 1. Mean uptake per group over time (with p-values from 2-sample t-test against reference)
Figure 4. Uptake (in SUV) for group and time. (The error bars are the standard deviations of the corresponding samples).
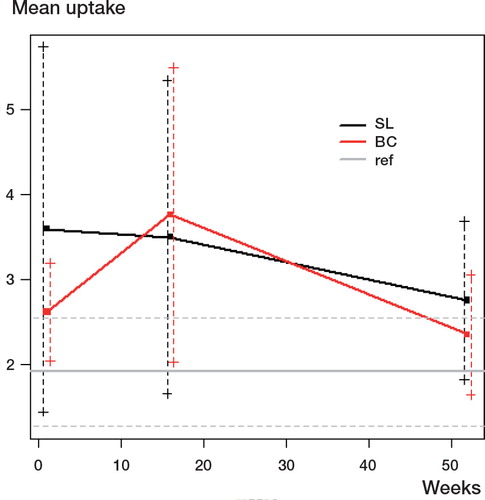
Table 2. Differences in uptake (BC – SL) (p-value from t-test of “mean = 0”)
Figure 5. Mean activity (in SUV) for the 13 ROIs 1 year after surgery for the SL group without the case with a loosening stem (♦) and for the single case with a loosening stem (×).
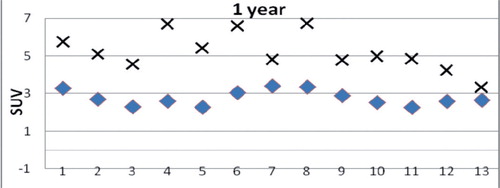
Figure 6. Uptake (in SUV) for each individual case in the BC group, for the 3 time points.
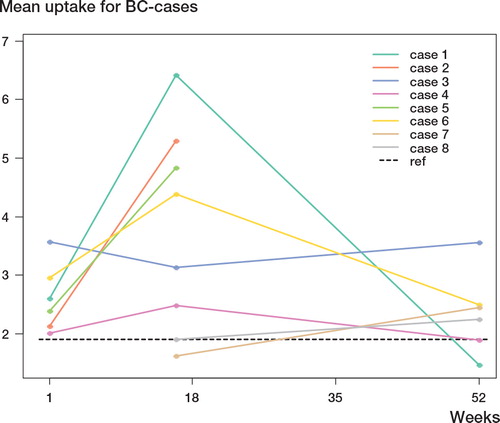
Figure 7. Uptake (in SUV) for each individual case in the SL group, for the 3 time points.
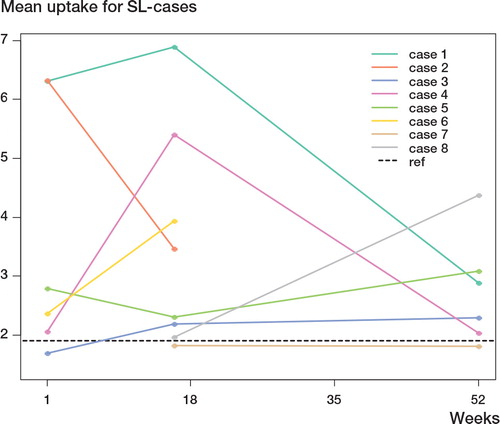
Figure 8. Postoperative radiographs of the stem that later became loose.
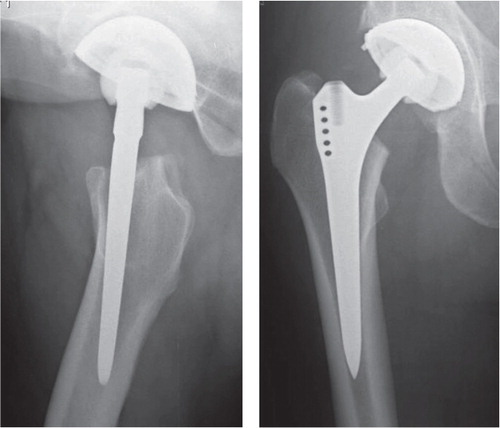
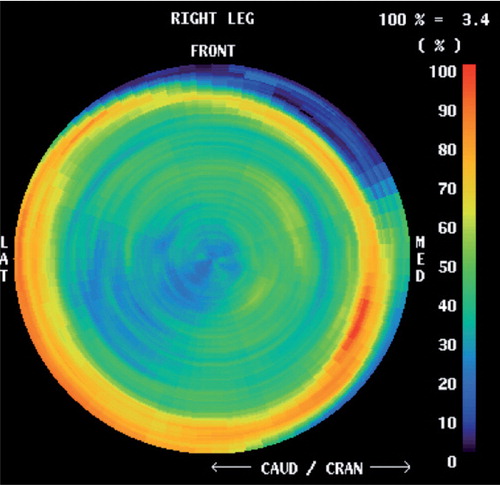
Figure 9. Maximum-detail Polar Map image of bone mineralization activity in femur adjacent to a femoral stem. The image view corresponds to looking down inside the femur from the top (the stem is invisible). Red indicates high activity and blue low.