Figures & data
Figure 1. A. 3-D CT scan showing detection of the medial and lateral border and the middle of the tibial tuberosity (TT) and the level at which the proximal AP tibial axes were identified. B. Axial CT scan illustrating the projection of the TT (filled circles) and of the femoral transepiconylar axis (FTA) (red line). The white dash-dot line represents AP axis 1, connecting the middle of the FTA with the medial one-third of the TT. The green dotted line represents AP axis 2, connecting the posterior tibial notch with the medial border of the TT (Akagi line).
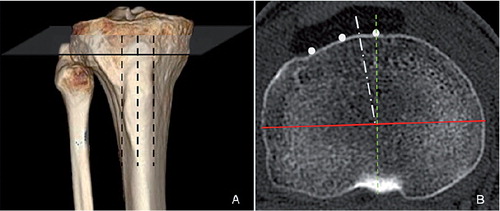
Figure 2. Axial CT scan depicting the intermalleolar distance (continuous black line) and its anterior projection (dotted black line). The white dotted line represents the center of the talar dome originating from the connection of 2 pints located in the middle of its anterior and posterior region (white continuous lines). Note that the center of the intermalleolar distance (dotted black line) is translated laterally with respect to the center of the talar dome.
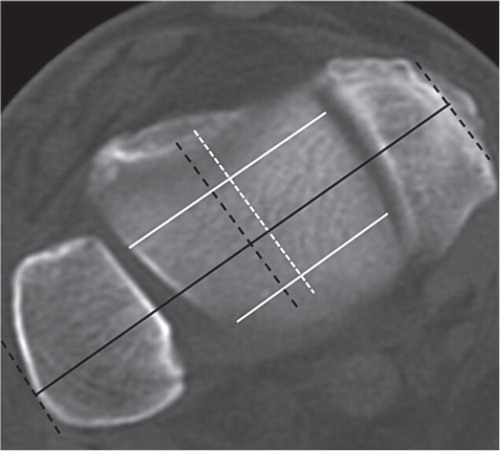
Figure 3. A. Axial scan showing proximal AP axis 1 passing through one-third of the tibial tuberosity (TT). B. Distal AP axis, i.e. the projection of the center of the ankle joint. C. Axial scan showing the mismatch in rotation alignment between proximal AP axis 1 (continuous red line) and the distal AP axis (dotted green line), the latter being externally rotated with respect to the former. D. Axial CT scan showing the extent to which, on average, the reference point of the ankle joint should be translated medially to compensate for tibial torsion (white dotted line) and for tibial torsion plus the difference in malleolar width (white continuous line).
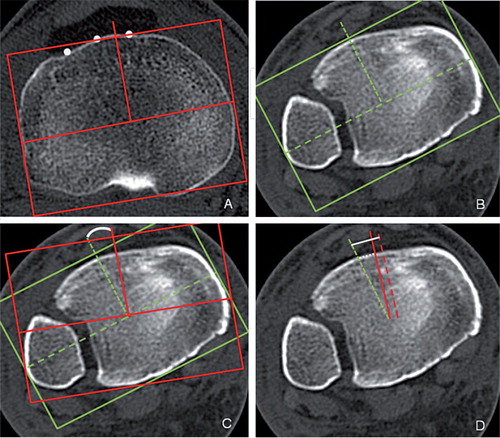
Table 1. Relationship between the center of the ankle joint, the intermalleolar distance, and proximal AP axes