Figures & data
Figure 1. Different osteoclasts. A: Giant osteoclast, detached from the bone, in a resorption cavity close to the fracture line of an atypical femoral fracture. B: Normal osteoclast in a healthy individual with tibial stress fracture.
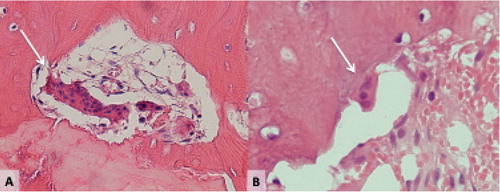
Figure 2. Bisphosphonate-associated shaft fractures show radiographic signs of stress fractures. Note the fracture line running perpendicular to the long axis of the femur and its origin at the tensional side of the bone. Black arrow: endosteal callus reaction. Horizontal white arrow: periosteal callus reaction. Oblique white arrow: medial spike.
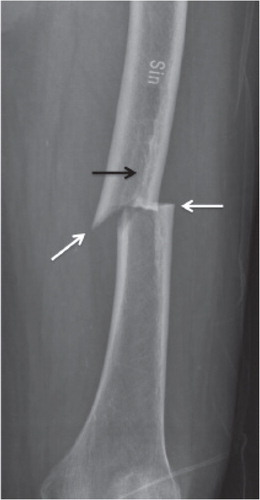
Figure 3. Upper part: Identification of atypical fractures in Paper I. Lower part: Further selection of cases and controls for Paper II.
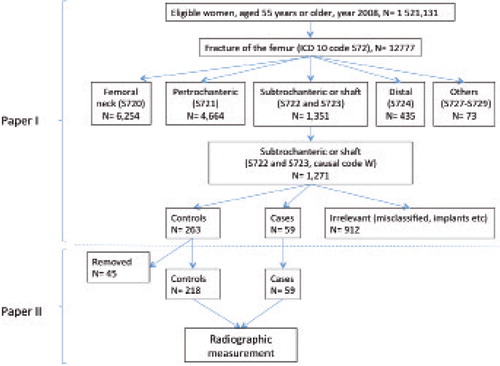
Table 1. Age-adjusted relative risk (RR) and absolute risk (AR), with 95% confidence intervals (95% CI), of atypical femoral fracture associated with the use of bisphosphonate during the 3 years (2005–2008) preceding the fracture
Table 2. Odds ratios (OR), with 95% confidence intervals (95% CI), for atypical femoral fractures associated with bisphosphonate use
Table 3. ASBMR Task force criteria for atypical femoral fractures from the first report in 2010 (left column) and revised after the second report in 2013 (right column). Bold font according to ASBMR´s original
Figure 4. Measurement of fracture angle. A: atypical femoral fracture with a fracture angle close to 90 degrees measured on the proximal shaft fragment. B: fracture with an angle of about 30 degrees.
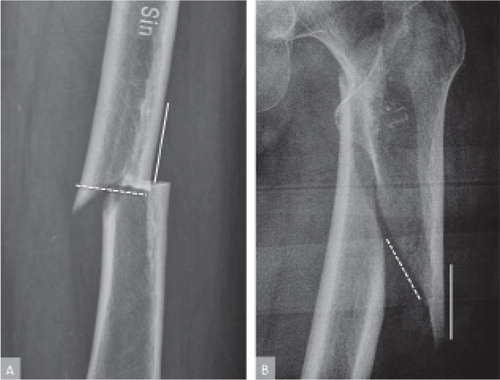
Figure 5. Frequency distribution of fracture angles. Fracture angles occurred in three different peaks. The peak in the middle represents a distinct subpopulation with fracture lines running close to perpendicular to the lateral cortex of the femoral shaft, i.e. 89 degrees, SD 10.
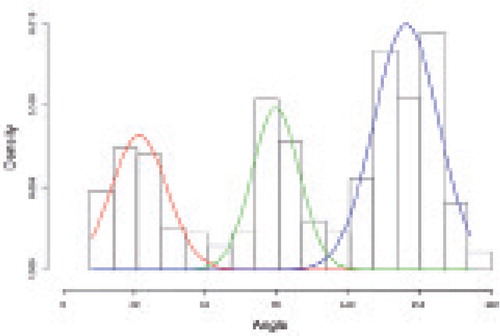
Table 4. Specificity and sensitivity of radiographic features to detect bisphosphonate treatment with 95% Confidence Intervals (CI)
Figure 6. A: Fracture line in the operating field surrounded by callus formation seen as a slight elevation of the surface. B: Bone biopsy including the fracture line.
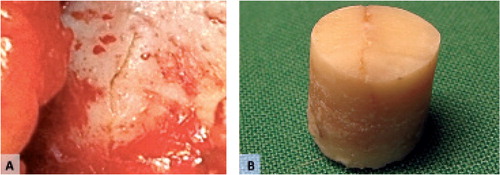
Figure 7. Incomplete fracture. A: conventional radiograph. B: Cortical defect after taking a biopsy. C: Microradiography of the bone biopsy. Note the fracture line.
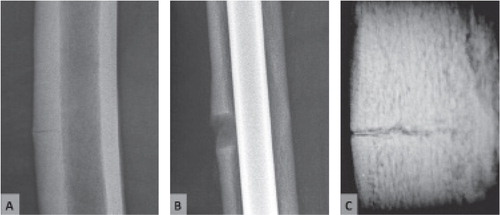
Figure 8. Incomplete fracture. g fracture gap, a amorphous material, r resorption cavity.
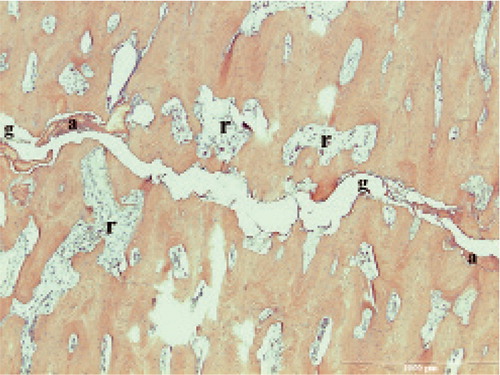
Figure 9. Incomplete fracture. g fracture gap. b bone fragments about to break off. d cellular remnants. r resorption cavity almost reaching into the fracture gap.
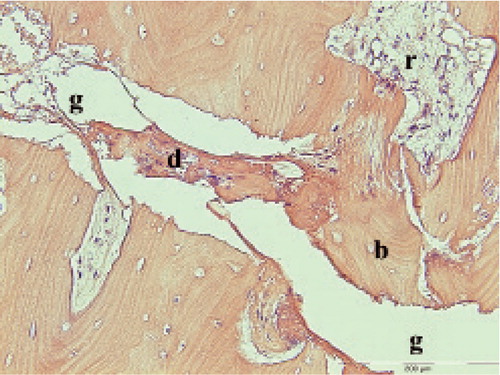
Figure 10. Incomplete atypical fracture, 18 months after cessation of bisphosphonate treatment. C periosteal callus. Dashed lines: fracture gap. White arrows: Remodeling within the fracture gap.
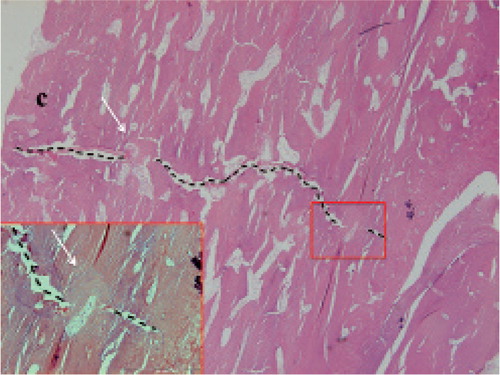
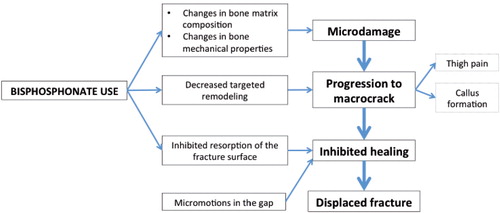
Figure 11. Hypothesis on the series of events leading to atypical femoral fracture.