
Figures & data
Figure 1. Patient flow chart.
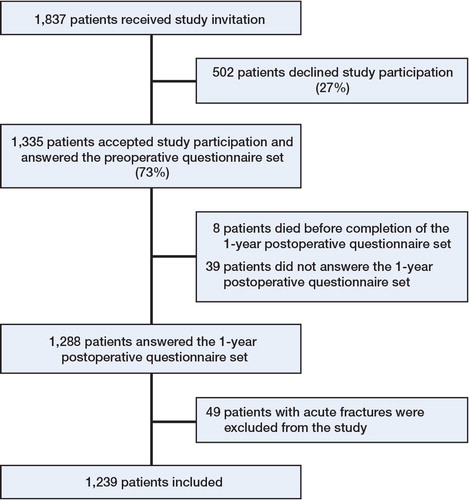
Table 1. Characteristics of the 1,837 patients who received an invitation to participate in the study in the period from March 1, 2010 to March 1, 2011
Table 2. Minimal clinically important improvement (MCII) for HOOS and EQ-5D. Values are cut-point (95% CI) or AUC f
Table 3. Patient–acceptable symptom state (PASS) for HOOS and EQ–5D. Values are cut-point (95% CI) or AUC f
Table 4. Patient–acceptable symptom state (PASS) for different subgroups; mean (95% CI)
Supplemental material