
Figures & data
Table 1. Study characteristics
Table 2. Study characteristics of randomized controlled trials assessing intertrochanteric fractures
Table 3. Study characteristics of randomized controlled trials assessing femoral neck fractures
Figure 1 Mortality rate 1 year postoperatively for studies published in the 1980s, 1990s, and 2000s. Average 1-year mortality for each time period was calculated using the mortality rate of each trial in that time frame, weighted by sample size.
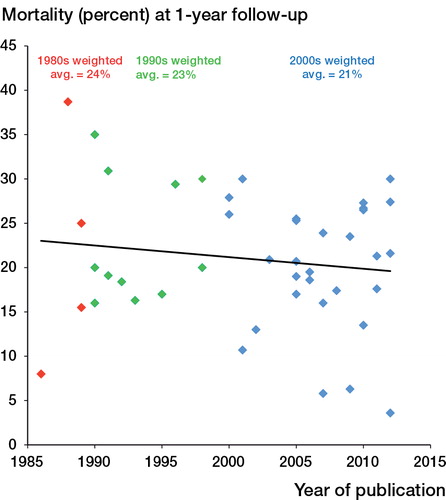
Figure 2. Mortality rates by fracture type. A. Mortality rates in RCTs assessing treatment of intertrochanteric fractures: mean rates for trials published before 2000 and after 1999. B. Mortality rates in RCTs assessing treatment of femoral neck fractures: mean rates for trials published in the 1980s, 1990s, and 2000s. Number of trials and combined sample size of these trials (in brackets) are given next to each data point.
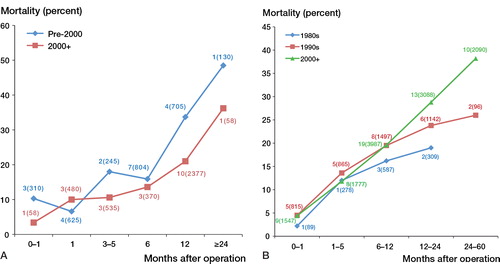
Table 4. Mortality and reoperation rates in femoral neck and intertrochanteric hip fractures over time