
Figures & data
Survival analysis of bipolar and unipolar implants in the age group 60–74 years.
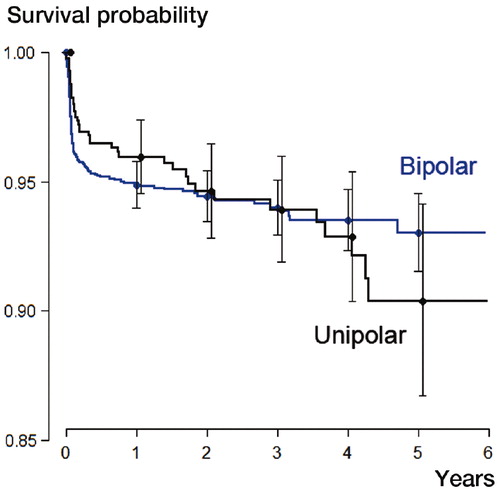
Table 1. Crude reoperation rates
Table 2. Risk factors for reoperation of any kind for different age groups. Cox regression analysis with hazard ratios (HR) and 95% confidence intervals (CI). Head design has been omitted for ages 60–74 years due to lack of proportionality
Table 3. Risk factors for reoperation due to specific complications for all ages. Cox regression analysis with hazard ratios (HR) and 95% confidence intervals (CI)
Table 4. Risk factors for reoperation due to specific complications for patients in 3 age groups (A–C). Cox regression analysis with hazard ratios (HR) and 95% confidence intervals (CI). Head design has been omitted for ages 60–74 years due to lack of proportionality