Figures & data
Incidence of fractures in the study population
Figure 1A. The crude incidence of fractures per 1,000 person years by age. Error bars indicate 95% confidence intervals.
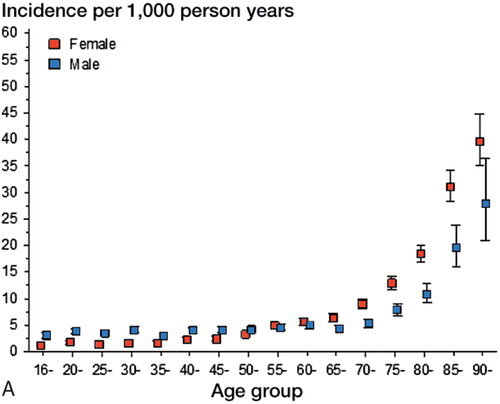
Figure 1B. The incidence rate ratios in women relative to men for all fractures. Error bars indicate 95% confidence intervals.
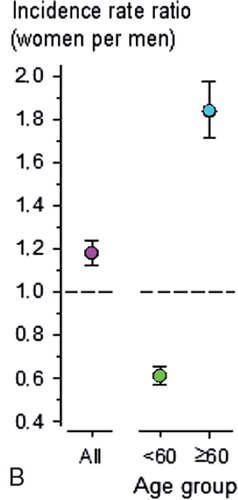
Figure 2. Incidence of the 4 most commonly treated fractures in men and women who were younger and older than 60 years of age.

Figure 3. Age- and sex-specific incidence of the 4 most commonly treated fractures requiring hospitalization. Error bars indicate 95% confidence intervals.
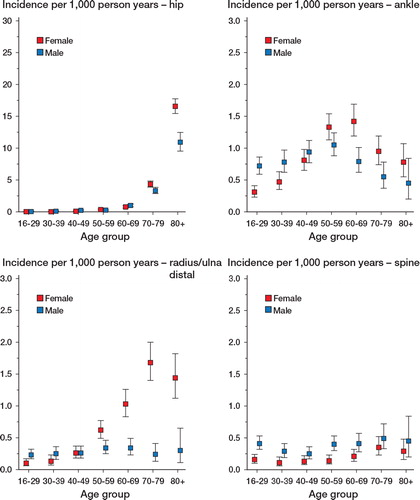
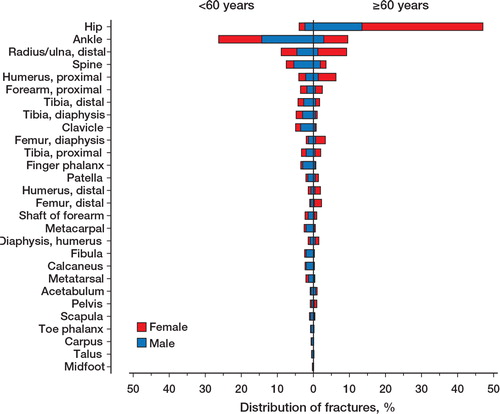
Figure 4. Distribution of fractures between women and men who were younger and older than 60 years of age.