Figures & data
Figure 1. The implant system obtained in 2003. A. Overview image. B. Closer view of the bone-anchored part, showing a large amount of bone surrounding the implant. C. Overview image of the ground section, showing the material fracture at the distal end (arrows), the large amount of mainly compact bone around the implant (arrowheads), and trabecular bone inside the implant (*). There is a central area devoid of tissue due to the retrieval procedure (#).
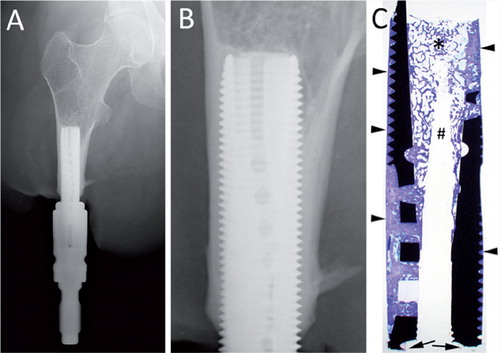
Figure 2. Light microscopic images of the ground section. A. Overview of one side of the implant. B. A closer view of one of the transversal holes in the implant, connecting the outer surface with the hollow inner part. C and D. Many threads were completely filled with mature, Haversian bone. E and F. Closer view of the bone in contact with the implant surface, with multiple osteocytes close to the implant surface. G. The trabecular bone in the hollow center with bone trabeculae reaching to and condensing at the implant surface.
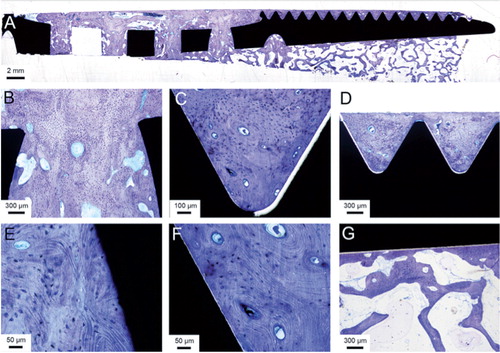
Figure 3. Back-scattered electron micrographs of the bone-implant bloc. A. Overview image of one side of the implant. B. A thread filled with compact bone, which contains several voids suggestive of vascular channels. C. Transversal hole with more porous bone, showing active remodeling with jagged areas (arrowheads) and newly, less mineralized osteoid (*). D. Haversian system (H) and osteocyte lacunae (oc), some of which are located close to the implant surface. E. At higher magnification close to the implant surface, showing canaliculi (c).
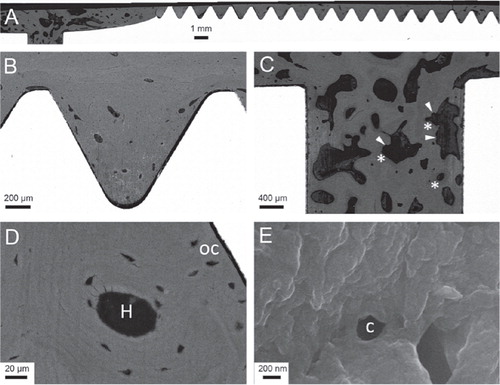
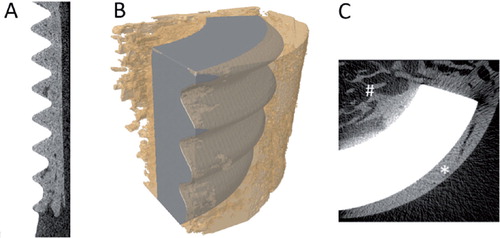
Figure 4. Micro-CT images. A. Longitudinal section of the data set with implant in white and bone in gray. B. Overlay image of contrast-segmented part of implant (gray) and bone (yellow; transparent) showing the osseointegration. C. Transaxial section of the data set with implant in white and bone in gray. The outer surface was dominated by cortical bone (*) and the inner surface was dominated by trabecular bone (#).