
Figures & data
Figure 1. PRISMA flow chart of study selection.
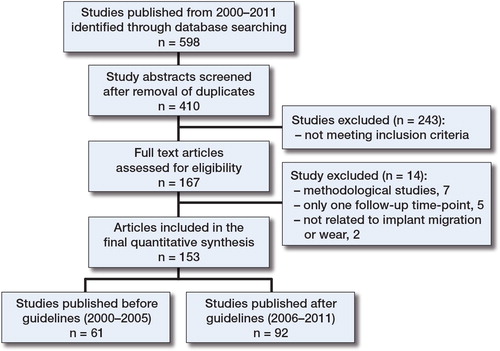
Table 1. List of the 13 guidelines and subcategories used to evaluate study adherence (adapted from Valstar et al. Citation2005)
Figure 2. The annual numbers of hip and knee arthroplasty RSA studies published from 2000 to 2011 that met the inclusion criteria (bars) and the proportion of studies with high adherence (line). The RSA guidelines where published at the end of 2005.
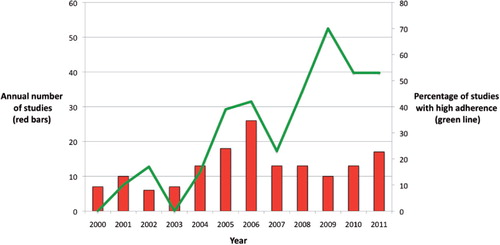
Figure 3. Adherence of studies published after the guidelines to each of the 13 individual guideline items. The levels of adherence are presented in green (full adherence), yellow (partial adherence), and red (no adherence). Guidelines are presented left to right from highest to lowest adherence. The guideline number is given in parentheses.
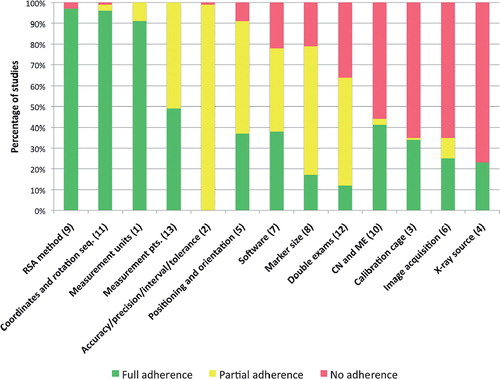
Table 2. Adherence of studies published during 2006–2011 to the RSA guidelines according to region of publication
Table 3. Adherence of studies published during 2006–2011 to the RSA guidelines according to journal
Table 4. Suggested presentation of standardized output for a clinical RSA study