
Figures & data
Figure 1. 32 patients with hip dysplasia were included from March 1, 2011 to December 1, 2011.
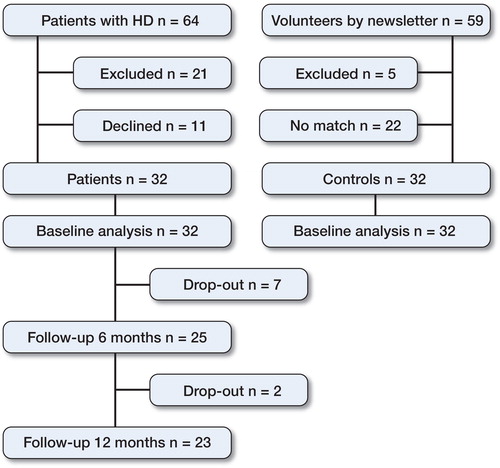
Figure 2. Mean values of peak joint angle (degrees) and peak joint moment (N*m/kg) during walking in the sagittal plane as a function of the stance phase (%).
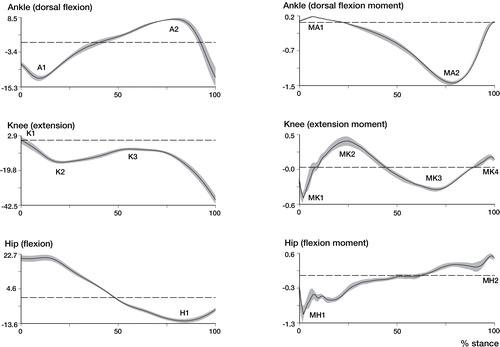
Table 1. Baseline characteristics a of patients and controls
Table 2. Peak joint angles in patients with hip dysplasia and in controls
Table 3. Peak joint moments in patients with hip dysplasia and in controls