Figures & data
Figure 1. Flow chart of the patients
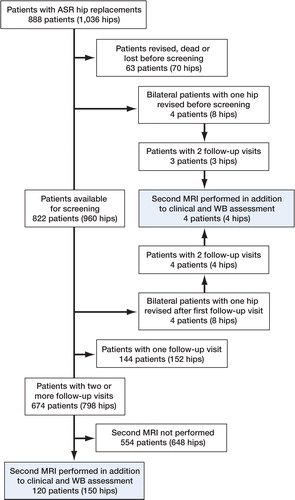
Figure 2. Scatter plot of follow-up time until first MRI against time interval between MRIs in the THR group.
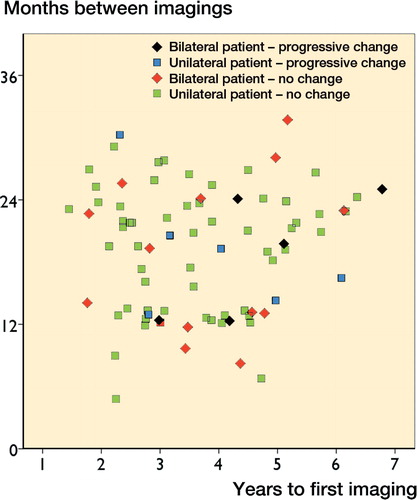
Table 1. Demographics of the patients
Table 2. Median clinical outcome scores and whole-blood (WB) metal ion levels at the first and second clinical evaluations
Table 3. Indications for the repeated MR imaging and results of the primary and repeated MRIs. Other reasons included control imaging due to scheduled revision (8 hips), enchondroma (2 hips), squeaking hip (2 hips), suspicion of latent infection (2 hips), joint effusion in primary MRI (1 hip), and occurrence of palpable lump in lateral thigh (1 hip). 1 patient who had both HR and THR is not shown in the table
Table 4. Comparison of clinical variables between patients with a significant imaging change and those without any change
Table 5. Contingency table showing MRI findings
Figure 3. Scatter plot of follow-up time until first MRI against time interval between MRIs in the HR group.
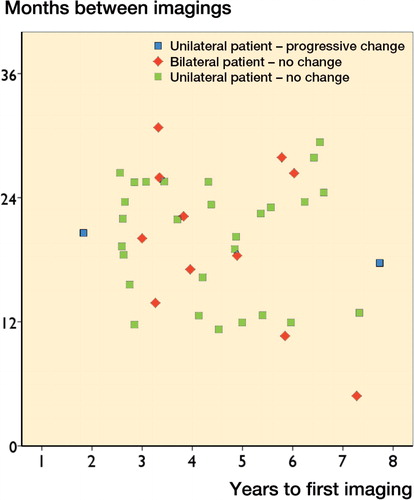
Figure 4. Man aged 41 at the time of the index operation for ASR HR. Time to first MRI (left) was 7.7 years. The time elapsed between imagings was 18 months. Both times, whole-blood Co and Cr remained below 4 ppb. MRI was repeated as a control imaging in the annual follow-up visit due to joint effusion seen in the first scan. However, development of a type-2A pseudotumor was seen.
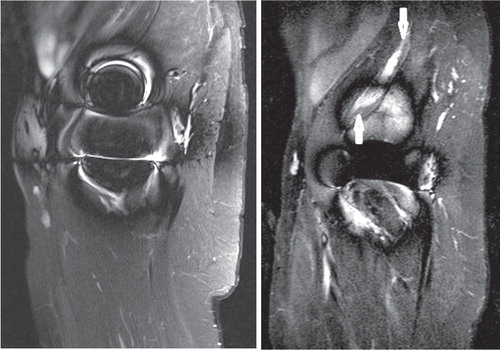
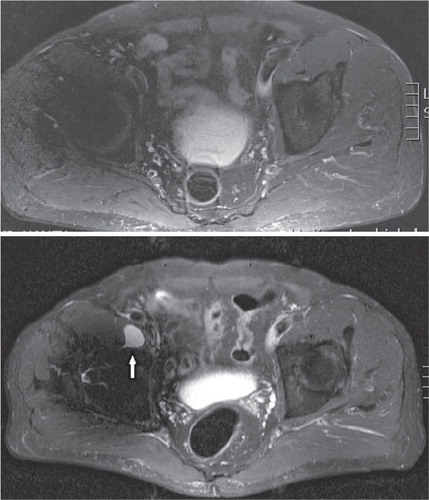
Figure 5. A man with ASR XL THR who was 69 years old at the index operation. Time to first MRI (top) was 2.3 years. The time elapsed between imagings was 2.5 years. Both times, whole-blood Cr remained below 4 ppb. Whole-blood Co increased from 7.2 ppb to 16 ppb. MRI was repeated due to increase in whole-blood Co levels and occurrence of stiffness in the operated hip. Control imaging revealed a newly formed cystic lesion (type 1).