Figures & data
Figure 1. Identification of atypical femoral fractures in the study population. Patients from 2008 were women only. a Mechanically altered femurs include patients with knee and hip prostheses, retained plates, screws, intramedullary nails, joint arthrodeses, and other conditions.
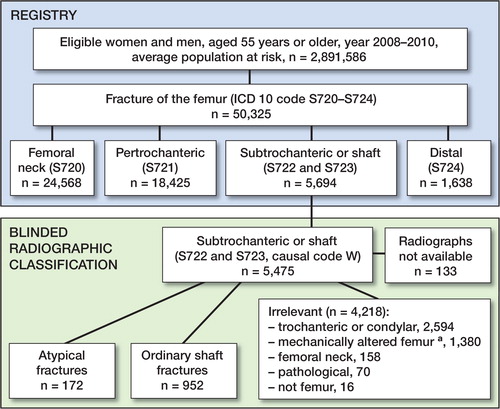
Table 2. Age-adjusted relative risk (RR) and absolute risk (AR), with 95% confidence intervals (95% CIs), of atypical femoral fracture associated with use of bisphosphonate in women and men 55 years of age or older, during the 3-year period 2008–2010
Figure 2. Age-adjusted relative risk of atypical femoral fracture in women, by duration of use compared to non-use. Relative risk estimates (dots) with error bars representing 95% CIs.
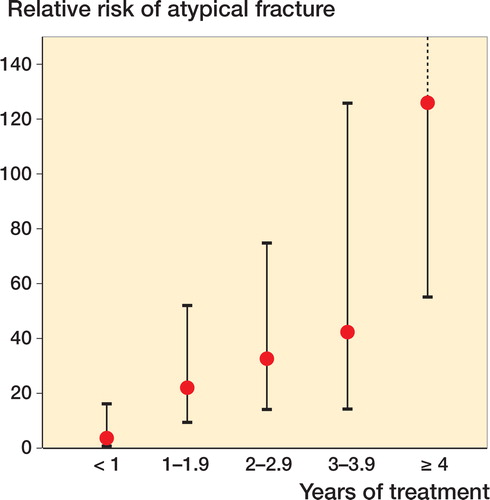
Table 3. Characteristics of stress fracture cases and controls with ordinary femoral shaft fractures
Table 4. Odds ratios (ORs), with 95% confidence intervals (CIs), for femoral stress fractures associated with bisphosphonate use
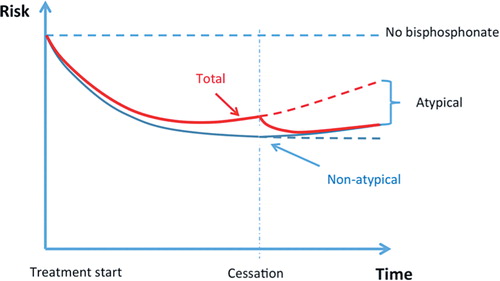
Figure 3. Schematic graph of risk over time, with arbitrary units. Blue curve: risk of fragility fracture; red curve: total fracture risk; dashed red line: projected total risk without cessation. The curves are based on the assumption that the protective effect against ordinary (non-atypical) fractures has a longer half-life than the risk of atypical fracture.