
Figures & data
Table 1. Primary diagnoses of patients with revision TAR and status after revision TAR including 95% CI for risk of new failure
Table 2. Types of primary prostheses in 69 patients who underwent revision TAR, and time from primary surgery to revision
Table 3. Causes of failure of primary TAR and status after revision TAR a
Figure 1. Flow chart of the 69 patients with revision TAR. a 4 patients with revision TAR <12 months ago not included in PROM evaluation.
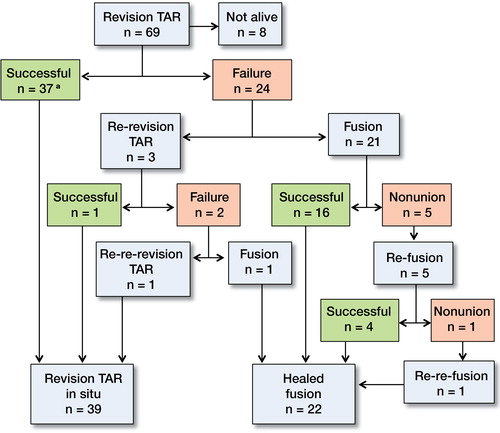
Figure 2. Survival of revision TARs, showing a 5-year survival rate of 76% and a 10-year survival rate of 55%. For comparison, the survival of primary TARs in the Swedish Ankle Registry (CitationHenricson et al. 2011b), modified by excluding meniscus exchange, showed a 5-year survival rate of 84% and a 10-year survival rate of 74%.
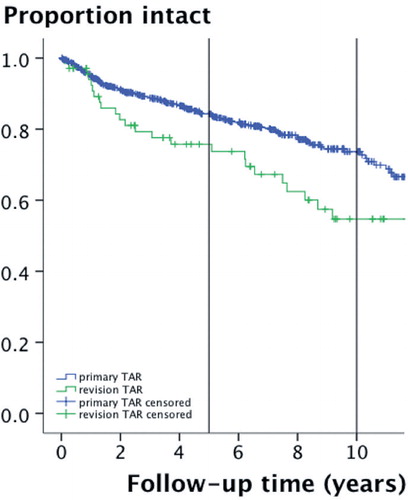
Table 4. Mean functional scores and patient satisfaction after revision TAR
Table 5. Degree of patient satisfaction after revision TAR related to primary diagnosis. Values are number of patients within each group