
Figures & data
Table 1. Clinical and demographic data in Charcot patients, diabetes controls, and healthy subjects
Figure 1. A and B. Box plots of plasma osteoprotegerin values (OPG, ng/mL) in Charcot patients (n = 24), diabetic controls (n = 20), and healthy subjects (n = 20) at inclusion (A) and at termination of the study after 2 years (B). Inter-group comparison performed by 1-way repeated measures ANOVA and post-hoc Holm-Šidak test.
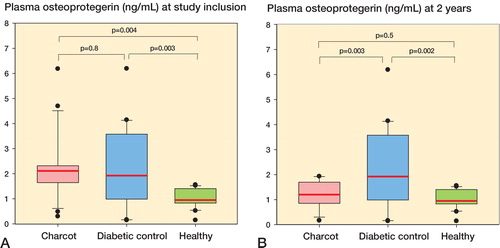
Figure 2. A and B. Box plots of plasma receptor activator of nuclear factor-κB ligand (RANKL, ng/mL) in Charcot patients (n = 24), diabetic controls (n = 20), and healthy subjects (n = 20) at inclusion (A) and at termination of the study after 2 years (B).
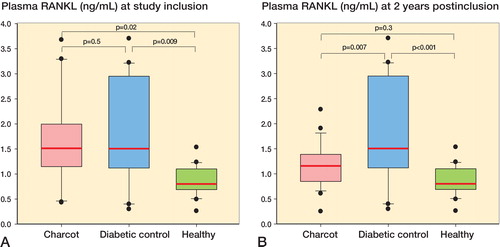
Figure 3. A and B.Box plots of plasma OPG-RANKL ratio in Charcot patients (n = 24), diabetic controls (n = 20), and healthy subjects (n = 20) at inclusion (A) and at termination of the study after 2 years (B).
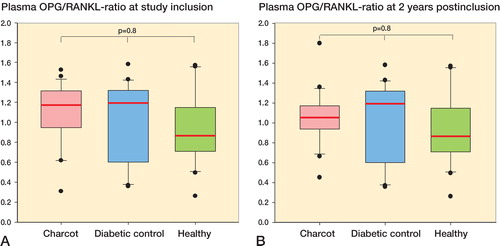
Figure 5. A and B. Box plots of plasma sclerostin (ng/mL) in Charcot patients (n = 24), diabetic controls (n = 20), and healthy subjects (n = 20) at inclusion (A) and at termination of the study after 2 years (B).
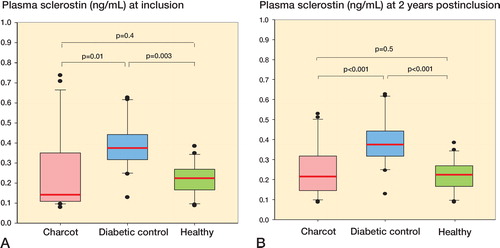
Figure 6. A and B. Box plots of plasma Dickkopf-1 (Dkk-1, pg/mL) in Charcot patients (n = 24), diabetic controls (n = 20), and healthy subjects (n = 20) at inclusion (A) and at termination of the study after 2 years (B). C. Trajectory of plasma Dkk-1 in Charcot patients throughout the observation period of 2 years, based on repeated sampling over time and relative to diabetic controls and healthy subjects. Mean (SEM). a p = 0.009 for Charcot patients at 4 months vs. Charcot patients at inclusion; b p = 0.01 for Charcot patients at 2 years vs. Charcot patients at inclusion, as analyzed by Mann-Whitney rank sum test.
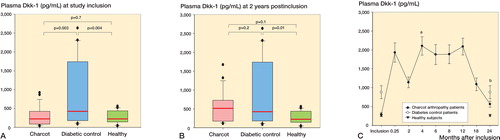
Figure 7. A and B. Box plots of plasma Wnt ligand-1 (Wnt-1, pg/mL) in Charcot patients (n = 24), diabetic controls (n = 20), and healthy subjects (n = 20) at inclusion (A) and at termination of the study after 2 years (B). C. Trajectory of plasma Wnt-1 in Charcot patients throughout the observation period of 2 years, based on repeated sampling over time and relative to diabetic controls and healthy subjects. Mean (SEM). a p = 0.003 for Charcot patients at 4 months vs. Charcot patients at inclusion; b p = 0.2 for Charcot patients at 2 years vs. Charcot patients at inclusion, as analyzed by Mann-Whitney rank sum test.
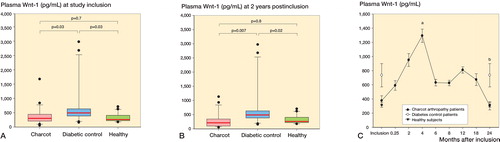
Figure 8. A and B. Box plots of plasma Wnt inhibitory factor-1 (Wif-1, pg/mL) in Charcot patients (n = 24), diabetic controls (n = 20), and healthy subjects (n = 20) at inclusion (A) and at termination of the study after 2 years (B).
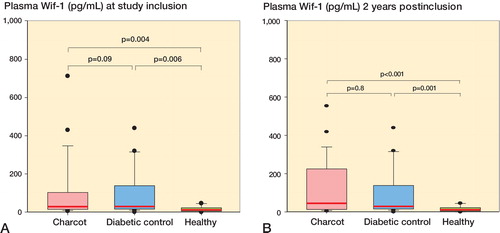
Table 2. Staging of radiographic changes in the Charcot arthropathy foot as described by CitationSella and Barrette (1999) based on weight-bearing radiographic examinations of the diseased foot; also, inflammation/bone edema on MRI based on activity (see Chantelau and Grutzner 2014) . Numbers in the table are numbers of patients.