Figures & data
Figure 1. Kaplan-Meier survival curves for 1,682 patients hospitalized for upper extremity fracture. The gray area indicates the 95% confidence interval.
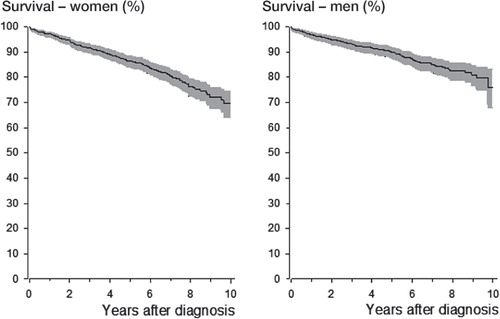
Figure 2. The relative survival of 1,682 patients hospitalized for upper extremity fracture (929 women and 753 men). The whiskers show the 95% confidence intervals, and the dashed line represents the expected survival in the general population.
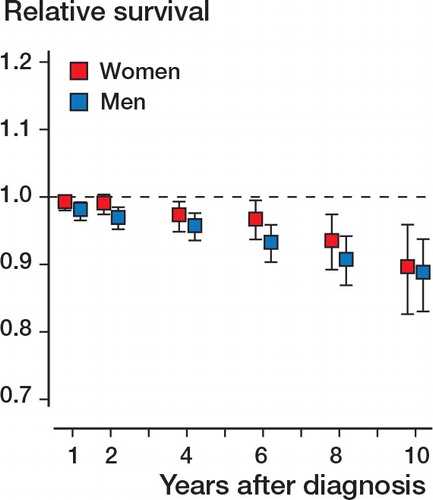
Figure 3. Standardized mortality ratios for 1,682 patients hospitalized for upper extremity fracture, by age group, with 95% confidence intervals. The dashed line represents the expected survival in the general population (standardized mortality ratio = 1).
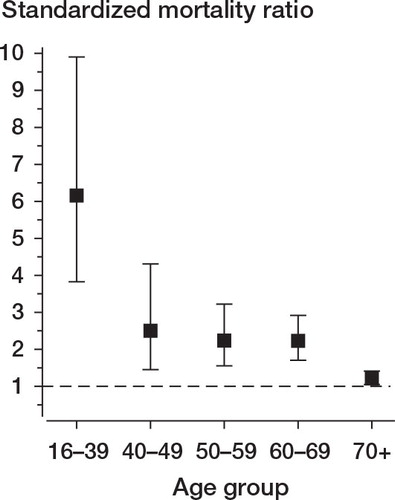
Table 1. Distribution of upper extremity fractures and mortality (per 1,000 person-years) in men and women hospitalized for upper extremity fracture (n = 1,682)
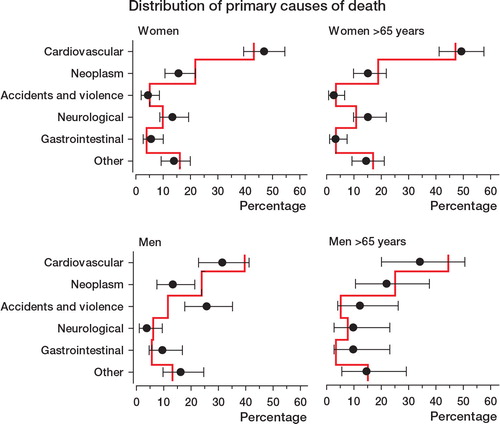
Figure 4. Distribution of primary causes of death in women and men. The whiskers show the 95% confidence intervals. The vertical dashed line indicates the distribution of causes of death in the general population.