
Figures & data
Figure 1. CONSORT 2011 flow chart of patients throughout the study.
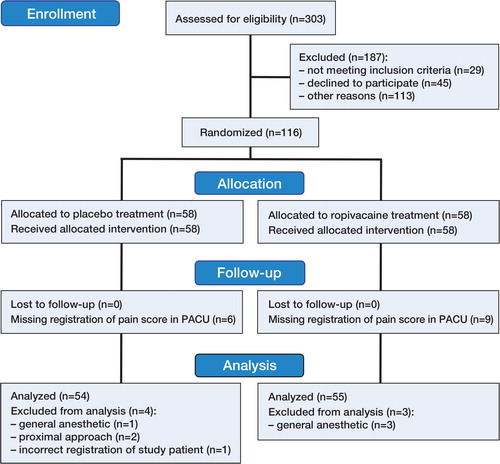
Table 1. Baseline demographic of study patients
Figure 2. Box plot showing pain score (NRS) during mobilization in the post-anesthesia care unit (PACU) and on the first postoperative day. The horizontal lines indicate median. The boxes represent interquartile range and the whiskers extend to the minimum or maximum case/value within 1.5 times the height of the boxes.
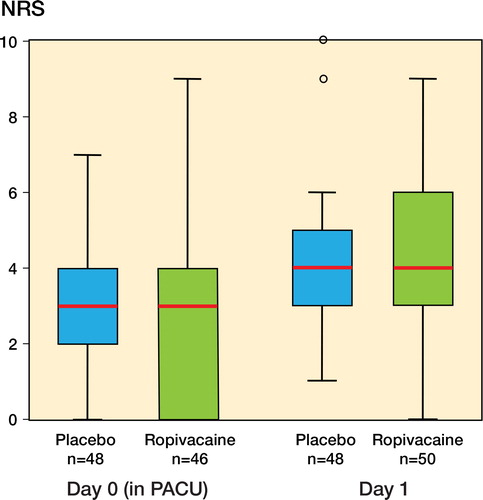
Table 2. Results