Figures & data
Table 1. Preoperative characteristics of patients in the direct lateral approach (DLA), posterior approach (PA), and anterior approach (AA) groups. Values are mean (SD) or mean (range)
Figure 4. Pain scores (numeric rating scale) in the direct lateral approach (DLA) group, the posterior approach (PA) group, and the anterior approach (AA) group pre- and postoperatively. The circles are outliers. These are defined as values that do not fall within the inner fences. The asterisks are extreme outliers. These represent cases or rows that have values more than 3 times the height of the boxes.
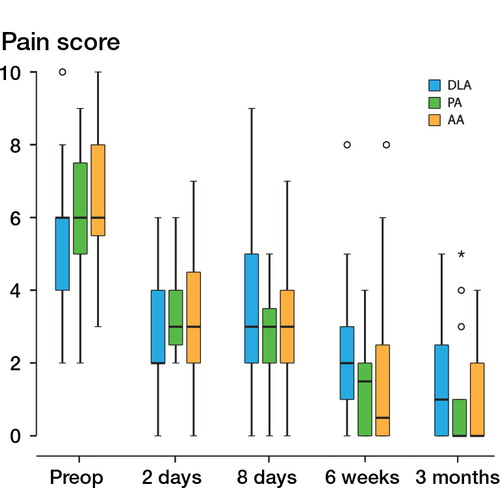
Table 2. Results from the leg-press test. Leg press (% compared with preoperative value)
Figure 5. Postoperative leg-press strength compared with preoperative values (100%) in the direct lateral approach (DLA) group, the posterior approach (PA) group, and the anterior approach (AA) group. #, Δ , and □ show statistically significant differences in percent change relative to preoperative values between groups.
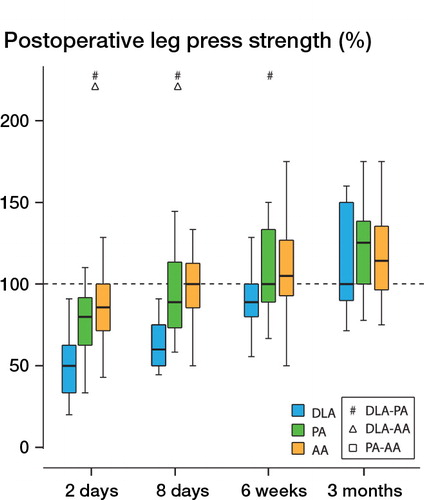
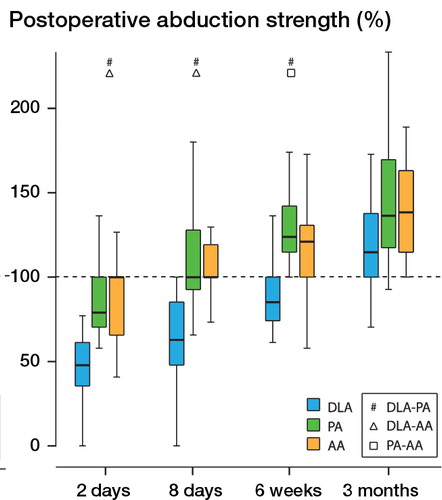
Table 3. Results from the abduction test. Abduction (% compared with preoperative value)
Figure 6. Postoperative abduction strength compared with preoperative values (100%) in the direct lateral approach (DLA) group, the posterior approach (PA) group, and the anterior approach (AA) group. #, Δ , and □ , see Figure 5