
Figures & data
Table 1. Patient demographics and surgical data
Table 2. Risk factors for calcar fracture
Figure 1. A. Radiological measurements of the proximal femur according to Noble: A, femoral head offset; B, femoral head diameter; C, femoral head position; D, canal width 20 mm above the mid-lesser trochanter line; E, canal width at the mid-lesser trochanter line; F, canal width 20 mm below the mid-lesser trochanter line; G, isthmus diameter; H, isthmus position below the mid-lesser trochanter line; I, neck-shaft angle. B. Radiological canal flare index (CFI) measurements of the proximal femur according to Noble: A, canal width +20 mm above the mid-lesser trochanter line; B, isthmus diameter. CFI = A / B. C. Radiological measurements of the proximal femur: canal-calcar ratio (X / Y) and cortical index ((Z − X) / Z).
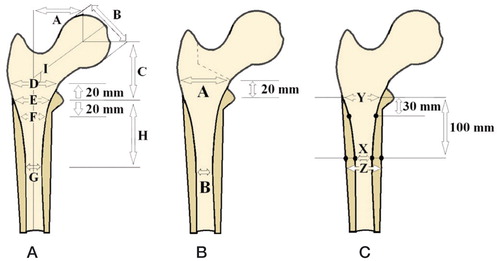
Table 3. Radiological measurements of femoral canal shape according to Noble (Noble et al. Citation1988)
Table 4. Classification of femoral canal shape according to Noble et al. (Citation1988). 118 hips in each group
Table 5. Radiological measurements according to Dorr et al. (Citation1993)
Table 6. Radiological classification according to Dorr et al. (Citation1993). 118 hips in each group
Table 7. Multivariable logistic regression analysis adjusted for age and sex. In the Noble classification, stovepipe-type and champagne flute-type proximal femurs were compared to normal-type proximal femurs. In the Dorr classification, Dorr type-B and Dorr type-C were compared to Dorr type-A