Figures & data
Figure 1. Schematic representation of the proposed method. A. Segmentation of the bone and prosthesis images based on the source images. B. Bone registration. C. Prosthesis registration. D. Quantification of the migration and its visualization.
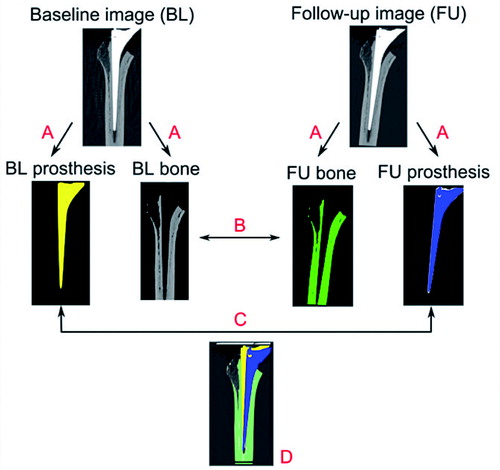
Figure 2. Translations and rotations are expressed based on a coordinate system with the tip of the prosthesis as origin. Positive translations along the X-axis correspond to medial migration, those along the Y-axis to proximal migration, and those along the Z-axis to anterior migration. Positive rotations about the X-axis correspond to anterior tilt, those about the Y-axis to retroversion, and those about the Z-axis to valgus.
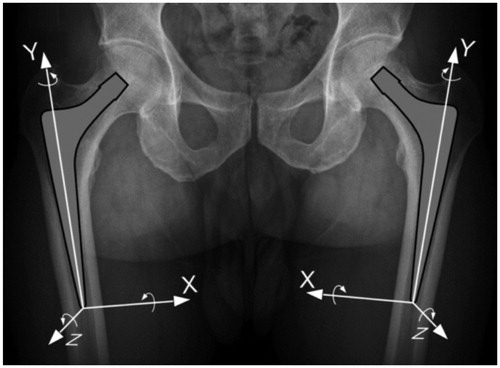
Figure 3. To determine accuracy, a CPT hip implant (Stem) was cemented in a proximal femur (Bone) and removed from the cement mantle. The bone was fixed to a wooden board and the stem was fixed to 3 stages, allowing movement of the stem in controlled steps along the Y- and Z-axes (translation) and about the Y-axis (rotation). To assess translations along the X-axis, the bone and stem were rotated 90° about the Y-axis and the “Z-stage” was used to translate the stem in a mediolateral direction.
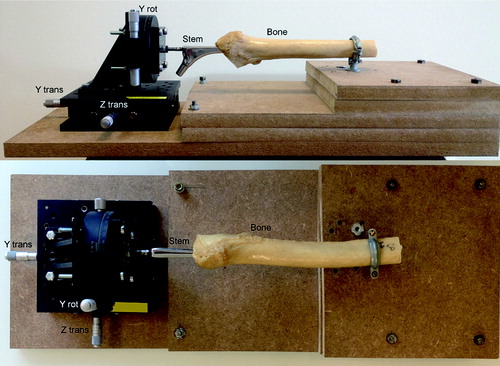
Table 1. Overview of the 39 comparisons between the baseline CT scanner and different degrees of translations and rotations used to assess the accuracy of the CTSA tool. Values are number
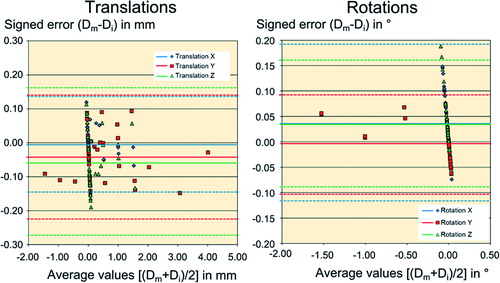
Figure 4. Bland-Altman plot of translations (left panel) and rotations (right panel) of the CTSA tool in the mechanical model. Horizontal lines refer to average values of the signed error for X-, Y-, and Z-translations and rotations (solid lines) and their 95% tolerance intervals (dotted lines).