
Figures & data
Figure 1. Implants by fixation. A. All ages. B. Age < 55 years. C. Age ≥ 55 years.
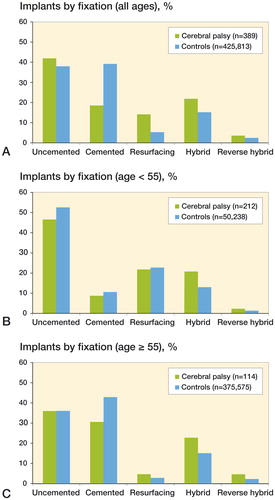
Table 1. Bearing surface used for the primary implants in the CP and control cohorts
Figure 2. Cumulative probability of revision (Kaplan-Meier, with pointwise 95% CIs) for CP vs. control patients.
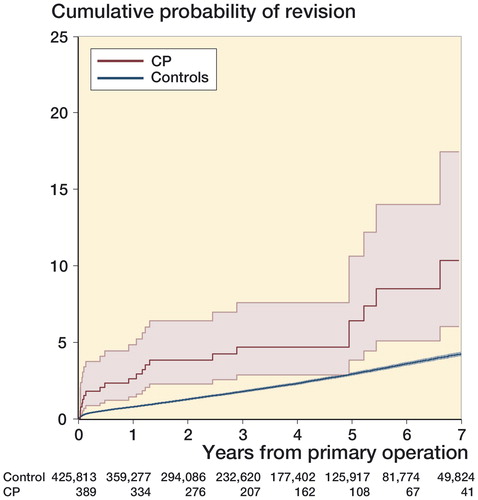
Table 2. Cumulative percentage revised (Kaplan-Meier) for CP and control patients at 1, 3, and 5 years after primary operation, for all cases and by implant type (fixation)
Table 3. Comparison of the EQ-5D health scale, EQ-5D index, and Oxford hip score (OHS) in CP patients and controls, before primary hip replacement and 6 months postoperatively