Figures & data
Table 1. Baseline characteristics of patients and infections, with results of infection treatment
Figure 1. 2-stage revision. A. Infected hip prosthesis in a 68-year-old woman. After extraction of the prosthesis, implantation of 360 gentamicin-PMMA beads for 2 weeks (B), then exchange to a spacer for 2 months (C). D. Puncture for culture, after 2 weeks of “antibiotic holiday”. E. After re-admission, extraction of the spacer and reimplantation of a total hip.
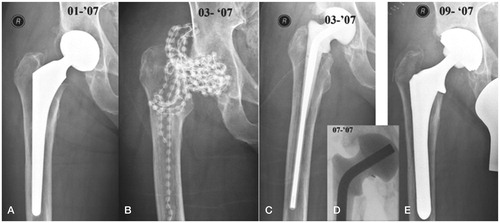
Figure 2. Diagram of treatments with data on reimplantation and healing of the infection.
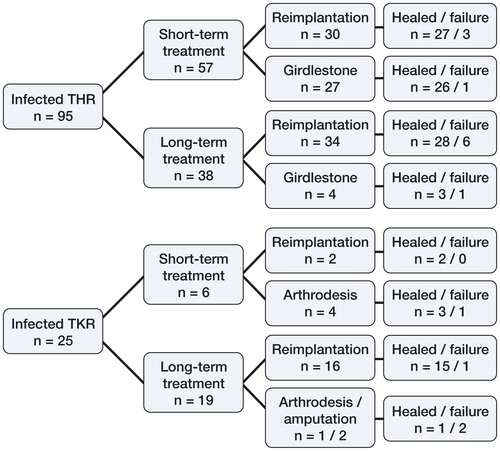
Table 2. Causative microorganisms
Table 3. Minimal inhibitory concentrations (MIC) of gentamicin with results of treatment
Figure 3. Kaplan-Meier curve depicting the time-to-event analysis with right-censoring, for healing of the infection. The event is healing for 6 months since the completion of the operative and antibiotic treatment.
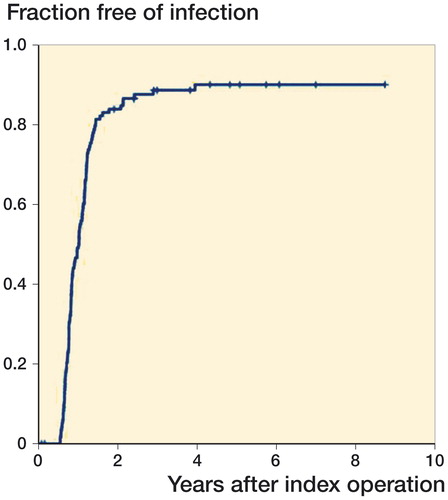
Figure 4. Kaplan-Meier curves for infection healing with strata for ASA classifications.
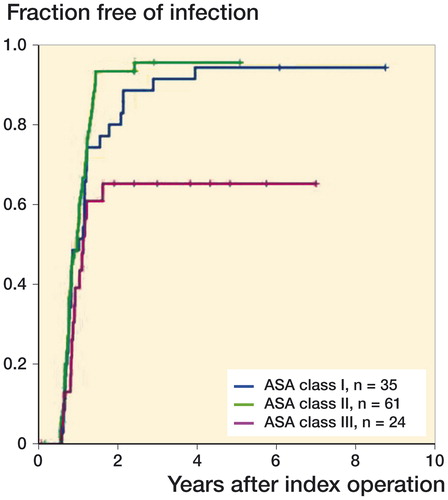
Figure 5. Kaplan-Meier curves for infection healing with strata for the classification of type of infection according Zimmerli.
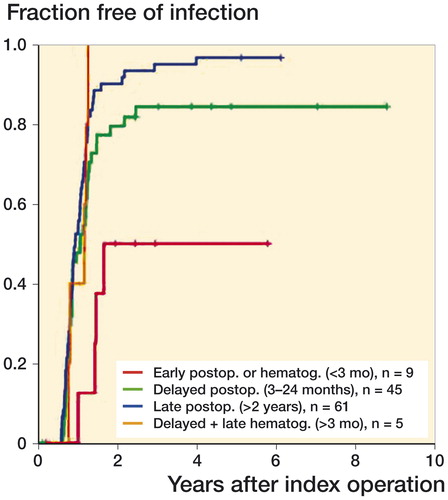
Table 4. Results in the literature of treatment of infected THR and TKR with hand-made or commercial antibiotic-loaded PMM beads
Figure 6. Proportions of short-term and long-term treatment in each 5-year period: increase in long-term treatment with time.
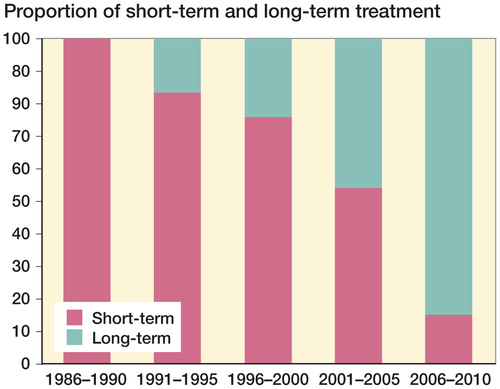
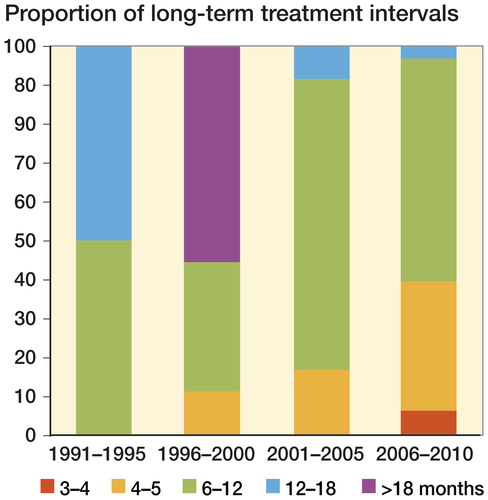
Figure 7. Intervals (months) of long-term treatment in four 5-year periods, with shorter intervals in more recent years.