Figures & data
Figure 1. Consort fl ow chart
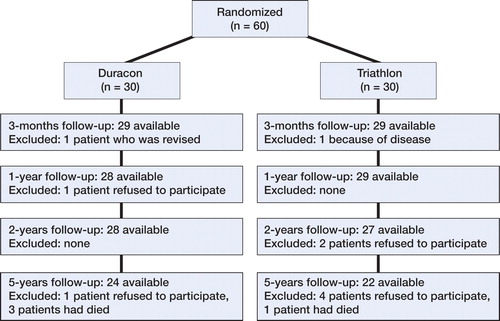
Table 3. Demographics
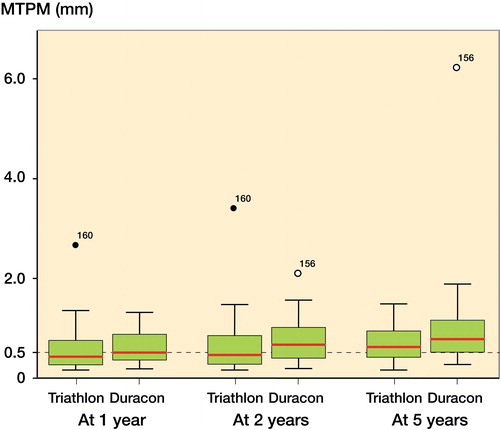
Figure 2. Box plots of median MTPM of the Triathlon group (left) and the Duracon group (right) at 1 year, 2 years, and 5 years. The horizontal hatched line denotes 0.5 mm. The central red line denotes the median value. The box denotes the second and third quartiles. The whiskers denote the range, excluding outliers. Dots denote outliers.
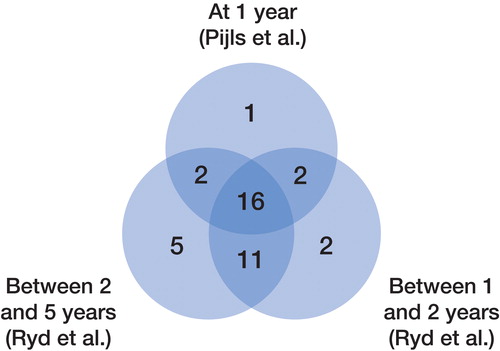
Table 4. The mean translation and rotation of the tibial component measured by RSA at 3 months, 1 year, and 2 years. Values are mean (SD)
Table 5. Numbers of patients classifi ed as having stable (St) or continuously migrating (CM) prostheses at 1, 2, and 5 years. 42 RSA assessments (n = 60) were complete at all 3 follow-ups. 16 baseplates were stable and 3 were continuously migrating at all 3 follow-ups. 18 were excluded because of missing data at any of the follow-ups or all of them
Figure 3. The numbers of patients who were classifi ed as stable at 1, 2, and 5 years were 21, 31, and 34, respectively, depending on the choice of method: MTPM <0.5 mm at 1 year according to Pijls et al., MTPM <0.2 mm between 1 and 2 years according to Ryd et al., or MTPM <0.3 mm between 2 and 5 years according to Ryd et al. 42 RSA assessments (n = 60) were complete at all 3 follow-ups. 16 baseplates were stable and 3 were continuously migrating at all 3 follow-ups. 18 were excluded because of missing data at any of the follow-ups or all of them. Fisher’s exact test: p-values <0.05 lead to rejection of the null hypothesis. There was no difference in prediction whether made at 2 years or 5 years.
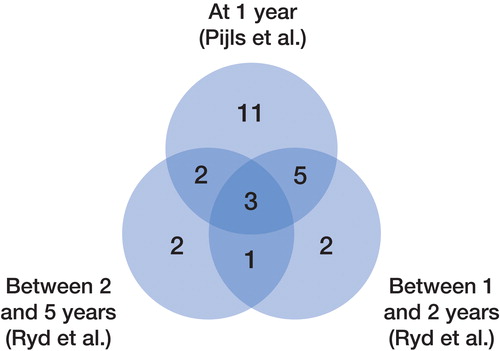
Figure 4. The numbers of patients classifi ed as having continuously migrating prostheses at 1, 2, and 5 years were 21, 11, and 8, respectively, depending on the choice of method: MTPM <0.5 mm at 1 year according to Pijls et al., MTPM <0.2 mm between 1 and 2 years according to Ryd et al., or MTPM <0.3 mm between 2 and 5 years according to Ryd et al. 42 RSA assessments (n = 60) were complete at all 3 follow-ups. 16 baseplates were stable and 3 were continuously migrating at all 3 follow-ups. 18 were excluded because of missing data at any of the follow-ups or all of them. Fisher’s exact test: p-values <0.05 lead to rejection of the null hypothesis. There was no difference in prediction whether made at 2 or 5 years.