Figures & data
Figure 1. Echocardiographic images before and during alcohol septal ablation. Long-axis apical view depicting typical features of hypertrophic obstructive cardiomyopathy including asymmetric septal hypertrophy and severe systolic anterior motion of the mitral valve (A). Left ventricular outflow tract obstruction was demonstrated by Color flow Doppler (B) and continuous wave Doppler (C) with a maximal instantaneous gradient of 101 mmHg at rest. Long-axis apical view during contrast administration shows potential area of necrosis in the basal anteroseptum (arrow) immediately prior to alcohol septal ablation (D).
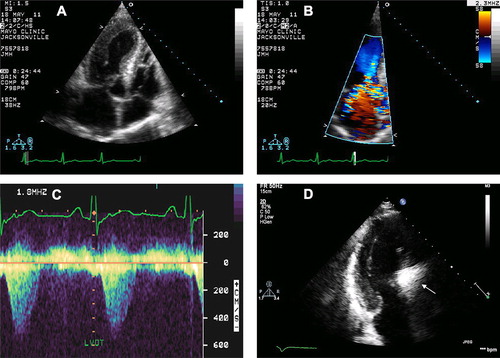
Figure 2. Cardiovascular magnetic resonance images before and after alcohol septal ablation. Steady-state free procession (SSFP) diastolic (A) and systolic (B) still-frame, long-axis images demonstrating hypertrophic obstructive cardiomyopathy with left ventricular outflow tract obstruction and secondary, severe eccentric mitral regurgitation (cine images provided in supplement). Delayed enhancement image post-gadolinium reveals no evidence of myocardial fibrosis (C). Prior to hospital discharge, repeat CMR was performed. A large, transmural, non-enhancing area of necrosis (arrow) was visualized in the basal anteroseptum on perfusion (D) and still-frame SSFP (E) images. Post-alcohol septal ablation cine images are provided in the supplement. Short-axis delayed enhancement image (F) reveals large area of microvascular obstruction, or ‘no reflow,’ as demonstrated by the large, non-enhancing inner core.
Figure 3. Von Willebrand Factor gel electrophoresis before and after alcohol septal ablation. Gel electrophoresis of VWF before (left), after (middle) with pooled plasma control (right). Loss of highest molecular weight multimers (HMWM) due to high intravascular shear is present in both patient specimens. The fraction of HMWM (normal > 10%) improved from 3–6% post-procedure. In the low molecular weight region, more dense bands indicate increased proteolysis, and this also is less post- versus pre-procedure.