Figures & data
Figure 1. Electrocardiogram demonstrated atrial fibrillation with a rapid ventricular response rate and ST-segment depression in leads II, III, aVF, and V1 to V5. Scale: 25 mm/s; 10 mm/mV.
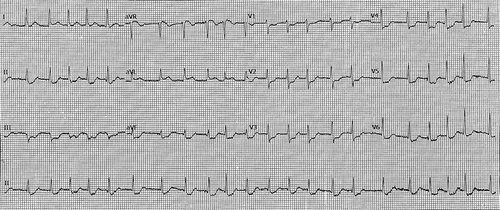
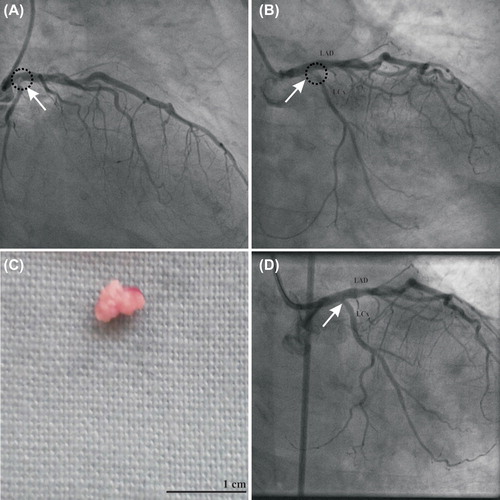
Figure 2. Coronary angiogram demonstrated a hazy filling defect (arrow) at the bifurcation of the distal left main trunk and left circumflex artery, depicted in right anterior oblique caudal (A) and left anterior oblique caudal projections (B). A fibrous mass was aspirated by a thrombectomy catheter (C), with resolution of the filling defect on coronary angiogram (arrow, D). LAD, left anterior descending artery; LCx, left circumflex artery.