Figures & data
Figure 1. Morphological categories of TDP-43 immunoreactive cytoplasmic aggregates in ALS lower motor neurons. (A) Skeins: these appear as multiple string-like TDP-43-positive aggregates (arrow head). (B) Dense round inclusions: these appear as dense, round TDP-43-positive aggregates (arrow head). (C–D) Overlaps: these appear as an intermediate between skeins and dense round inclusions. In C, the TDP-43-positive aggregate appears similar to a dense round inclusion but has diffuse aggregation emerging from the inclusion body (arrow head). In D, morphology is similar to a skein, but the string-like deposits are locally condensed and form a large, dense deposit (arrow head). Note that the aggregates are seen in what otherwise appear to be morphologically healthy neurons. (Scale bar = 10μm).
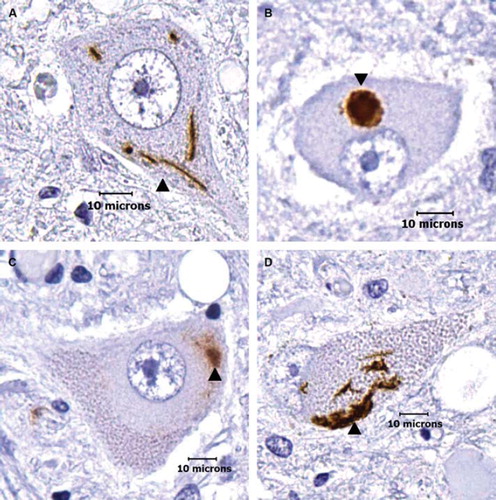
Table I. Clinical and pathological data.
Figure 2. Bar graph showing the percentage of TDP-43 immunoreactive cytoplasmic aggregates at the cervical, thoracic, and lumbar spinal cord levels and the medulla for all 25 nervous systems. TDP-43 aggregates show no statistical correlation between frequency and anatomical distance from disease onset, and are not indexed to topographic advance of disease. Bar graph shows composite data.
Table II. Percentage of ALS neurons with TDP-43 aggregates.
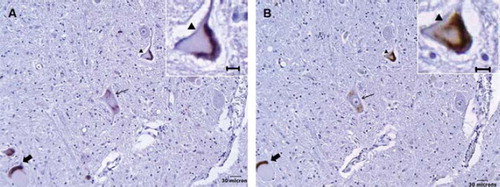
Figure 3. Correlation between ubiquitinated and TDP-43 immunoreactive cytoplasmic aggregates in ALS lower motor neurons. (A) Ubiquitinated aggregates in three separate motor neurons. (B) TDP-43 immunoreactive aggregates in the adjacent section showing corresponding changes (respective arrows). The morphological appearances are similar between ubiquitinated and TDP-43 immunostaining; inlays show respective magnified images (arrowhead).