Figures & data
Table I. Genes proposed to cause Mendelian forms of ALS.
Figure 1. ALSoD homepage.
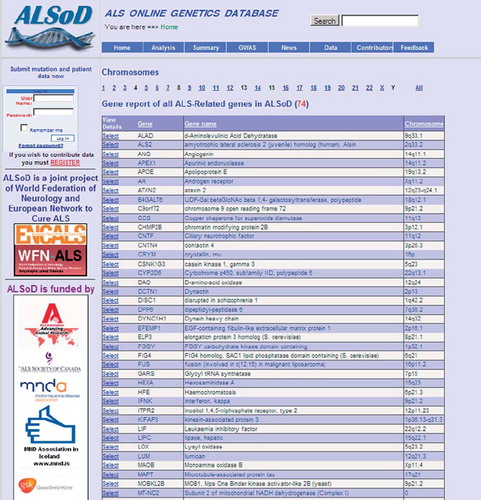
Figure 2. Genotype-phenotype summary for TARDBP (coding for TDP43). Gene summaries are displayed on selection. More detailed customised analyses are also possible allowing specific questions to be asked of the database.
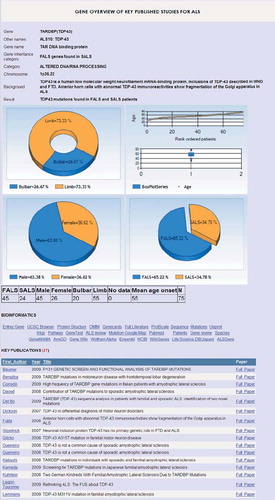
Figure 3. An example of a geographical overview of the mutation distribution of SOD1. Geographical analysis is available for most FALS genes. More sophisticated map overlays are planned.
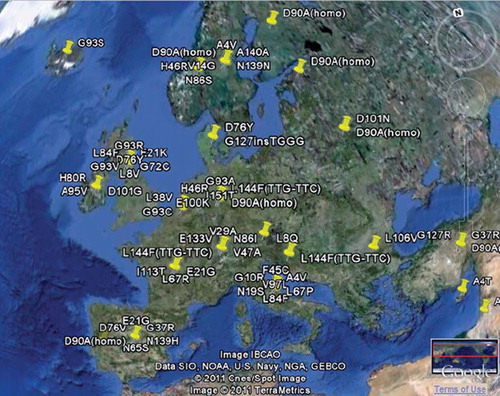
Figure 4. Gene interactions using a GeneMANIA interface at ALSoD. Potential gene pathways and networks can be explored via the GeneMANIA feature on ALSoD, e.g. by including established or proposed ALS genes in the functional predictions.
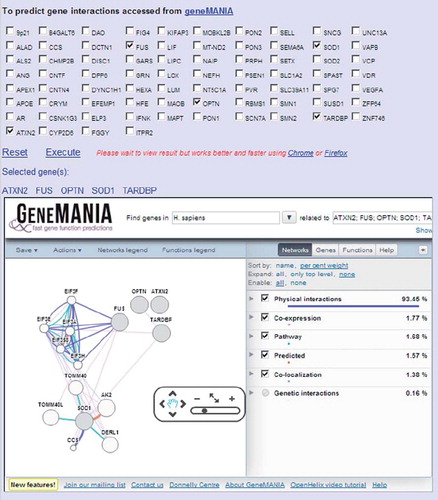
Figure 5. Screenshot of the ALSGene homepage (www.alsgene.org).
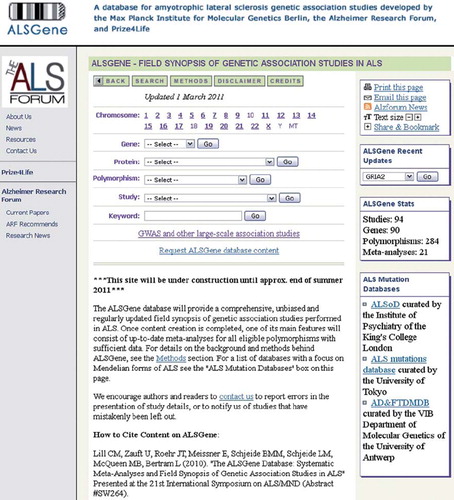
Figure 6. Summary of ALSGene methodology. Flowchart of data selection, processing and analysis strategies applied for ALSGene. Polymorphisms with non-overlapping data from at least four data sets are subjected to meta-analyses. Significant meta-analysis results are highlighted in a designated section on the ALSGene homepage.
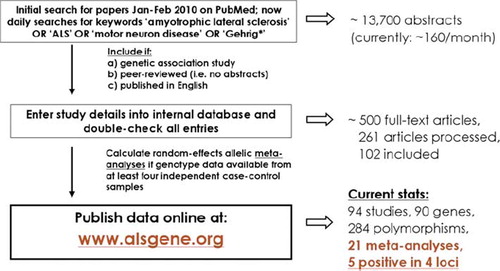
Figure 7. Random-effects meta-analysis of rs12608932 in UNC13A including all published studies (as of 1 March 2011). Example ALSGene forest plot providing a visual summary of meta-analysis results. Study-specific odds allelic ratios (ORs, bottom section) are displayed either as provided in the original publication or calculated de novo from allele or genotype summaries. Black squares represent point estimates of the OR (scaled to sample size), horizontal lines represent 95% confidence intervals. Summary ORs (top section) are then calculated from the study-specific ORs using random effects models for a number of different paradigms. Grey diamonds represent point estimates and 95% confidence intervals of the respective meta-analyses. I2 = a measure of between-study heterogeneity (see text for more details). Forest plots are only available for polymorphisms that have data available from four independent data sets.
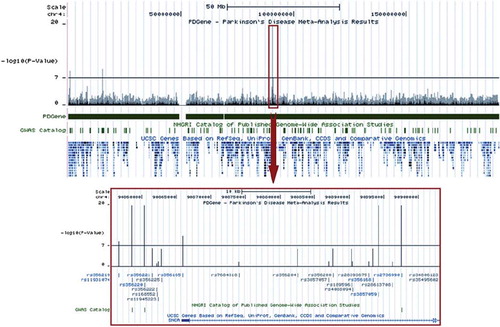
Figure 8. Example screenshot of a customized UCSC genome-browser track (PDGene database) displaying meta-analysis p-values. The USCS genome-browser (http://genome.ucsc.edu/cgi-bin/hgGateway) presents an up-to-date, easy-to-navigate interface of the human genome. It integrates information from a broad variety of databases (e.g. gene-mapping, expression, evolutionary conservation) at base-pair resolution. Shown is an example screenshot for a customized browser track from the PDGene database maintained by our group (http://www.pdgene.org), which summarizes meta-analysis results (-log(10)) p-values, based on data from both genome-wide and candidate-gene association studies) equivalently at base-pair resolution. SNPs (rs-numbers) displayed in grey are based on meta-analyses of available GWAS datasets, those displayed in blue are supplemented by candidate-gene/replication datasets. All rs-numbers cross-link back to the PDGene database to provide more details on the respective meta-analyses. Note that this feature will become available on ALSGene once initial data entry and analysis is completed.