Figures & data
FIGURE 1 Germ cells in isolated cysts pass through meiosis and histone to protamine transition in culture. Time-lapse series of fluorescence micrographs of two independent isolated cysts developing in culture. Cysts of primary spermatocyte (A) and round nuclei stage (C) were isolated from testes of flies containing H2AvD-RFP and ProtamineB-eGFP fusion genes and their development was followed in culture (25°C). Part of the resulting time-lapse series of a primary spermatocyte cyst (A, B) is continued by the series of a cyst cultured at the round nuclei stage (C–G). The temporal resolution of this virtual time-lapse is one image per 10 h starting at meiotic division. The drawings next to the fluorescence micrographs represent the stage of the cysts as seen in phase contrast. At the nebenkern stage (B, ca. 10 h after division), the spermatid nuclei (n) are flanked by the nebenkern (nk) and the spermatids are surrounded by two somatic cyst cells (cy). At the round nuclei stage (C, ca. 20 h after division), germ cell nuclei are visible as a cluster and the nebenkern has elongated along the growing axonem of the flagella (fl). At the elongated nuclei stage (D, ca. 30 h after division), the nuclei are ellipsoid and the flagella have grown. At the canoe stage (E–G), nuclear shaping continues in parallel to chromatin reorganization. The early canoe stage, characterized by histone-based chromatin with H2AvD-RFP, appears to be extended in duration and is recognized at 40 and 50 h after division. Cysts cultured at the round nuclei stage complete the histone to protamine transition (F–G) and the late canoe stage chromatin is characterized by ProtamineB-eGFP (G). Scale bar: 50 μm.
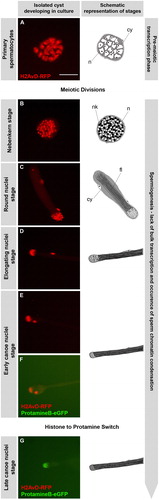
FIGURE 2 Time frame of the histone to protamine switch in nuclei of cultured spermatid cysts. Time-lapse series of phase contrast and fluorescence microscopic images of the tip of a spermatid cyst cultured in vitro. Spermatid cysts were isolated from testes of transgenic flies containing H2AvD-RFP and ProtamineB-eGFP fusion genes. At the start of the series, spermatid nuclei (arrows) show a clear H2AvD-RFP signal, whereas no ProtamineB-eGFP expression is detected (A). After 5 to 6 h of incubation (25°C), the histone signal has disappeared and the ProtamineB-eGFP signal is at a higher intensity (F–G). During the switch process, at 2 to 3 h, a short overlap of histone and protamine expression occurs, albeit with low fluorescence intensity of both marker proteins (C–D). Scale bar: 15 μm.
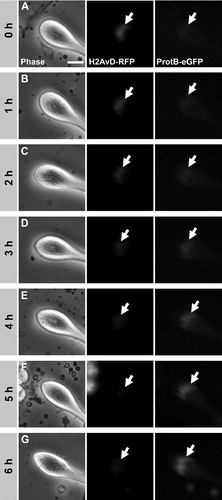
FIGURE 3 Cytotoxicity of anacardic acid (AA) in spermatogenic cells is low compared to garcinol and AA does not induce apoptosis. (A) Pupal testes showing a single ProtamineB-eGFP positive cyst were incubated for 11 h without inhibitor (A, a and a′) or with 150 μM AA (A, b and b′) and 50 μM garcinol (A, c and c′). The number of ProtB-eGFP expressing cysts (arrows) increases in control testes after 11 h of culture (A, a′). Such an increase is also observed in AA-treated testes (A, b′), whereas treatment with garcinol blocks further development of post-switch cysts (A, c′). (B) Out of 23 pupal testes in the control culture, 95.7% developed further ProtB-eGFP positive cysts after 11 h of culture as did 73.9% of 23 AA-treated testes. However, further development was observed in only 13.6% of 22 garcinol-treated testes. (C) Squash preparations of nuclei from pupal testes cultured either without inhibitor (C, a and b) or with 150 μM AA (C, c and d). DNA was stained with Hoechst (C, a, b, c, and d) and DNA breaks were visualized by the TUNEL assay (a′, b′, c′, and d′). Primary spermatocytes from AA-treated testes show chromatin distortion (C, c compare to a), but no increase in TUNEL signal (c′), indicating that apoptotic DNA degradation is not involved in this effect. The TUNEL signal in AA-treated early canoe stage nuclei (d′) is not above control level (b′).
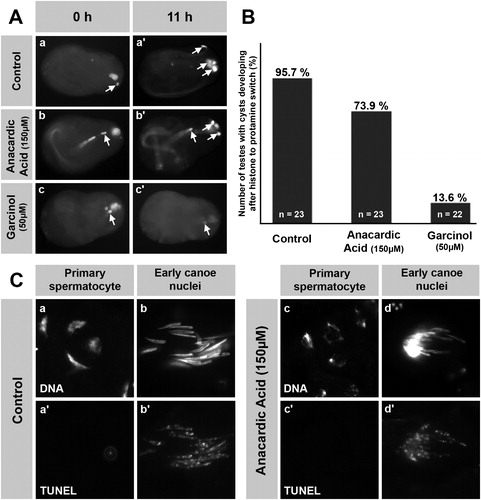
FIGURE 4 Anacardic acid (AA), but not trichostatin A (TSA), inhibits the histone to protamine switch in cultured, intact pupal testes. (A-D′) Pupal testes (24 h after puparium formation) of ProtamineB-eGFP expressing flies were incubated for 24 h in medium without inhibitors (A, A′) and medium supplemented with either 150 μM AA (B, B′), 5 μM TSA (C, C′), or 50 μM TSA (D, D′). No ProtamineB-eGFP expressing cysts can be observed at the beginning of the culture (A-D). After 24 h of incubation, some cysts have undergone the histone to protamine switch and ProtamineB-eGFP positive cysts (arrows) can be observed in control and TSA-treated testes (A′, C′, D′). However, testes treated with AA do not develop ProtamineB-eGFP positive cysts (B′). (E-F′) Low magnification overviews of squash preparations of untreated (E, E′) and AA-treated (F, F′) pupal testes. Expression of Tpl94D-eGFP is no longer detectable after treatment with AA (F, F′, arrows indicate nuclei of the latest observable stage). Arrowheads in A-D mark auto-fluorescence of putative fat body cells. Scale bar: A-D′ 100 μM; E-F′ 100 μM.
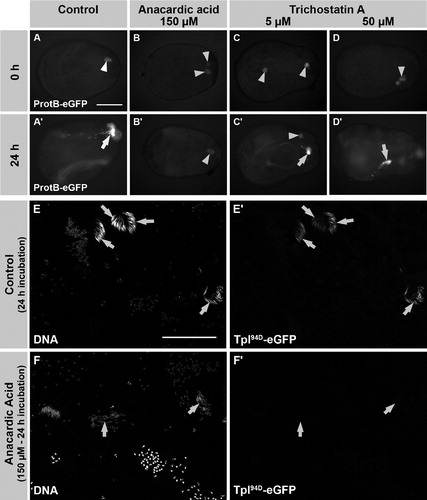
FIGURE 5 Histone H4 hyperacetylation occurs in the late elongating nuclei stage after meiosis, while histone H3K9 acetylation is found only at basic levels postmeiotically. Squash preparations of spermatid nuclei from adult testes. DNA is stained with Hoechst (rows A and E). Histone expression is represented by H2AvD-RFP fusion protein (row B) and shows loss of histones after the early canoe stage (columns 4–5). Protamine incorporation is visualized by the ProtamineB-eGFP fusion protein at the late canoe stage (row D, column 5). Histone H4 acetylation is marked with an antibody recognizing acetylated lysine 5, 8, 12, and 16 (row C). H4 acetylation is reduced to basic levels at the round nuclei stage (row C, column 2) after meiosis and then reappears in the late elongating nuclei stage and persists until histone degradation (row C, columns 3 and 4). H3K9 acetylation is found only at very low basic levels after meiosis (row F; tested with two independent antibodies). Scale bar: 10 μM.
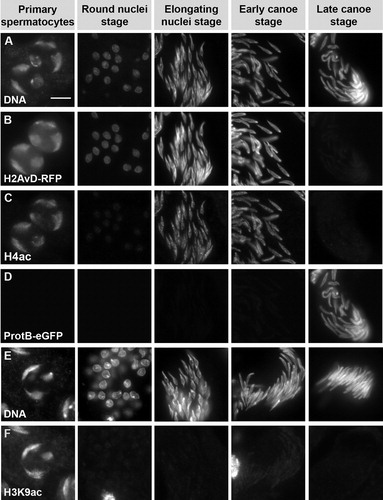
FIGURE 6 Anacardic acid (AA) and trichostatin A (TSA) affect acetylation of histone H4 and spermatid chromatin structure. Squash preparations of spermatid nuclei from pupal testes incubated with 150 μM AA (rows D-F) and 50 μM TSA (rows G and H) in comparison to untreated testes (rows A-C). DNA is stained with Hoechst (rows A, D, and G). H4 acetylation (rows B, E, and H) and H4R3-dimethylation (rows C and F) are detected by immunofluorescence. Treatment with AA leads to a complete reduction of H4 acetylation signal in all spermatid stages (row E), while other modifications like H4R3-dimethylation are not affected (compare rows C and F). In AA-treated samples the chromatin is strongly compacted in comparison to control samples (rows A and D). Although a spermatocyte nucleus is spread over a larger area after AA treatment (row D, column 1), the three large chromosome domains still appear to be strongly compacted in comparison to the untreated nuclei (row A, column 1). The AA-induced compaction is easily observed in the postmeiotic stages. Treatment with TSA leads to a decondensed chromatin structure, as is visible in premeiotic spermatocytes (row G, column 1). TSA also induces increased H4 acetylation in primary spermatocytes (row H, column 1) as well as the round nuclei stage (row H, column 2) after meiosis. In later stages, this effect seems to fade and is not detectable any longer (row H, columns 3 and 4). Scale bar: 10 μM.
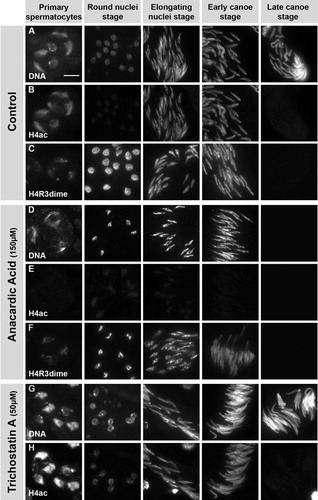
FIGURE 7 Trichostatin A- (TSA) induced, premature H4 acetylation does not induce premature DNA breaks. Squash preparations of nuclei from pupal testes cultured without inhibitor (A) or with 5 μM TSA (B) or 50 μM TSA (C). DNA was stained with Hoechst (row a). H4 acetylation was detected by antibody (row b) and DNA breaks were detected with a TUNEL assay (row c). Treatment of pupal testes with the HDAC inhibitor TSA leads to an increase in H4 acetylation signal at the round nuclei stages (B-C, row b, column 2) that is not seen in control testes (A, row b, column 2). However, this is not accompanied by a significant increase of TUNEL signal (B-C, row c), indicating no premature induction of DNA breaks after TSA treatment. Scale bar: 10 μM.
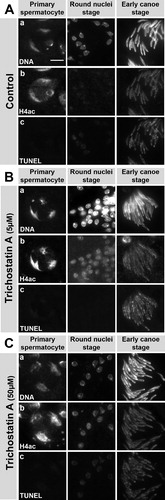
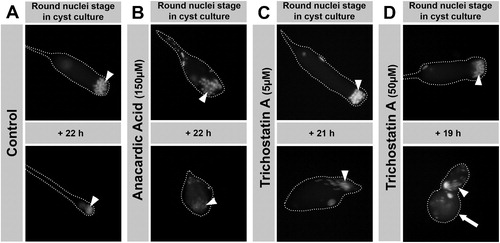
FIGURE 8 Anacardic acid (AA) blocks development of cultured, isolated cysts, whereas trichostatin A (TSA) treatment still allows progression of round nuclei stage spermatids to elongated stages. Fluorescence micrographs of isolated spermatid cysts in culture. The cyst shape is outlined with dashed lines. Round nuclei stage cysts were isolated from H2AvD-RFP expressing pupal testes and incubated without inhibitor (A) or with 150 μM AA (B), 5 μM TSA (C), or 50 μM TSA (D) for about 20 h. While control cysts develop from round nuclei (arrowhead) into the late elongated nuclei stage, this is not the case after AA treatment (B). AA blocks further development and nuclei become compacted and tiny (arrowhead). After TSA treatment (C, D), spermatid nuclei continue to develop into elongated nuclei stages (arrowheads), albeit TSA appears to influence cyst cell shape and growth (large arrow in D).