Figures & data
FIGURE 1 Sperm DNA fragmentation as visualized after application of the SCD test and staining using Gel Red. (a) Fresh sperm sample processed at baseline. Yellow arrows highlight sperm nuclei containing damaged DNA. (b) Fresh sperm sample after 24 h incubation. Green arrows show highly degraded sperm nuclei.
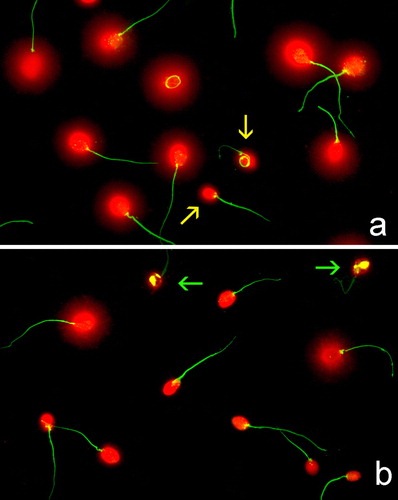
FIGURE 2 Graphic representation of different aspects of the dynamics of sperm DNA fragmentation. (a) Each line reflects SDF dynamics for one out of 15 donors. SDF was quantified in both fresh (black lines) and gradient-isolated (red lines) semen samples at time 0 and after 0.5, 1.5, 4.5, 6, 24, 48, and 72 h incubation at 37°C. (b) Box-and-whisker plots used to compare SDF distributions between semen samples (fresh in black, gradient-isolated in red) over time. Note the larger dispersion of data in fresh samples. Both treatment distributions tend to disperse after 24 h. (c) Mean±standard error is plotted for both fresh (black) and gradient-isolated (red) at the various incubation times. Interpolated lines have been superimposed on the graph.
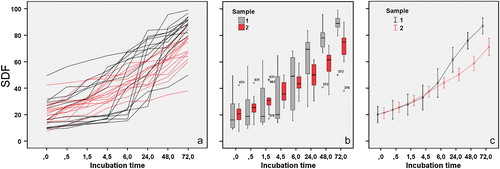
FIGURE 3 Graphic representation for the rSDF. (a, b) Fresh samples. (c, d) Gradient-isolated samples. Two time intervals were used for comparison: (a, c) from 0 to 6 h (rSDF1) and (b, d) from 6 to 24 h (rSDF2). The mean±standard error is shown for each case. See text for a more detailed explanation. (e) Box-and-whisker plots used to compare rSDF1 and rSDF2 data distributions between semen samples. Note the larger data dispersion observed for fresh samples.
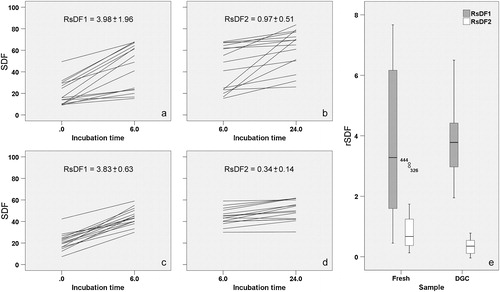
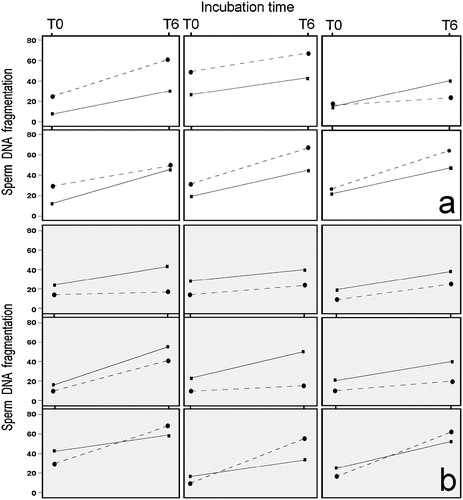
FIGURE 4 A graphic representation of the basal level of SDF and after 6 h of incubation for each donor. Continuous line: gradient-isolated sperm. Discontinuous line: fresh sperm. (a) Representation of the rSDF in six donors where the level of DNA damage after gradient isolation was lower than in fresh samples. (b) Representation of the rSDF in nine donors where the level of DNA damage after gradient isolation was higher than in fresh samples.