Figures & data
Figure 1. The effect of ghrelin on LH, FSH, and T. Serum concentrations of LH, FSH, and T in rats through intracerebroventricular administration with ghrelin. *indicates significant difference compared with the dosage of 0 nmol (P < 0.05).
Figure 2. Effect of ghrelin on T secretion by cocultured Leydig cells.
Figure 3. Histological observation of rat testis tissue by immunolocalization of GHS-R1a protein. (A) Testis: Leydig cells (arrow a), Sertoli cells (arrow b), primary spermatocytes (arrow c), secondary spermatocytes (arrow d), and spermatogonia (arrow e). (B) Testis: spermatids (arrow f). (C) negative control reaction carried out after substitution of PBS. A, B, C, Scale bar = 25 μm.
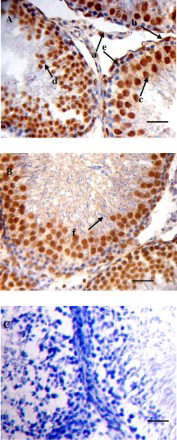
Figure 4. AR mRNA levels as a function of ghrelin. Expression of AR mRNA in the testis after injection of different dosages of ghrelin in rats. *significant differences between the control and injected group (P < 0.05).
Figure 5. Effect of ghrelin on AR mRNA expression by cocultured Leydig cells.