Figures & data
Figure 1. Staging of seminiferous tubules. The entire stages categorized from I to XIV, were classified into 4 groups; I ∼ VI, VII ∼ VIII, IX ∼ XI, and XII ∼ XIV. The data represent the mean values with SD. Statistical significance were not shown using Dunnett test in all stages. P values of each stage were: Stage I-VI 0 vs. 0.08: 0.500, 0 vs. 0.4: 0.5305; Stage VII-VIII 0 vs. 0.08: 0.3159, 0 vs. 0.4: 0.3693; Stage IX-XI 0 vs. 0.08: 0.2790, 0 vs. 0.4: 0.1980; and Stage XII-XIV 0 vs. 0.08: 0.4720, 0 vs. 0.4: 0.5052.
Figure 2. Exposure setup. A) Gross appearance of the inside of an exposure chamber with four animal cages; B) Schematic illustration of the exposure box.
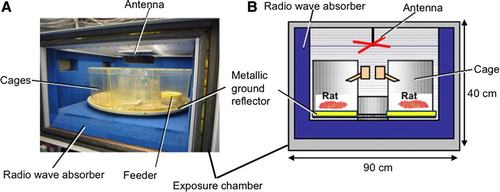
Table 1. Final body and reproductive organ weights.
Table 2. The count, mobility, and morphological abnormality of the sperm.
Figure 3. FDTD models of the exposure chamber with rats.
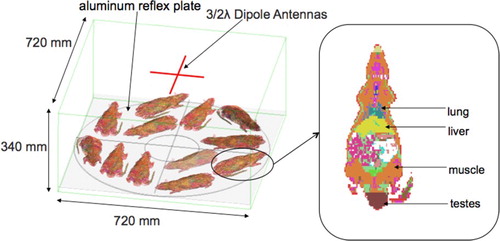
Table 3. Histopathological findings of reproductive organs.