Figures & data
Table 1. Comparison Between Semen Parameters, Age, and Sperm DNA Fragmentation with Fertilization Rate.
Table 2. The Effect of Standard Semen Parameters and DNA Fragmentation on Fertilization Rate.
Figure 1. Relationship between sperm DNA fragmentation and fertilization rate. Bar chart showing decrease in fertilization rate with increase in DNA fragmentation in the native system. Significance at *P < 0.05, ***P < 0.001.
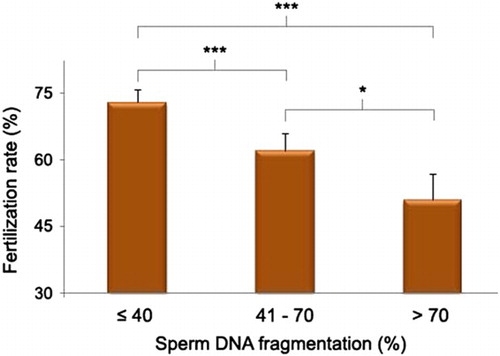
Figure 2. Relationship between progressive motility and fertilization rate. Bar chart showing increase in fertilization rate with increase in progressive motility. Significance at **P < 0.01, ***P < 0.001.
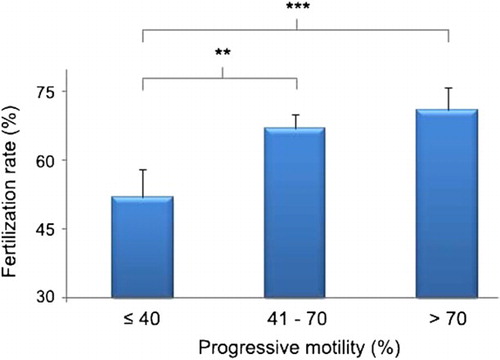
Table 3. Prognostic Value of Progressive Motility and Sperm DNA Fragmentation to Determine Fertilization Rate in vitro.