Figures & data
Figure 1. Case-control study of pre-eclamptic and normotensive pregnancies. A) IDO enzymatic activity levels in placental tissue. B) The levels of 8-OHdG in genomic DNA from placental tissue. These data were compared for normotensive pregnancy (open bars) versus severe pre-eclampsia (grey bars). Each bar represents the mean value. Vertical bars indicate the standard deviation.
Figure 2. Immunostaining of placental tissue cross-sections. A) Immunostaining of 8-OHdG using monoclonal antibodies (31 w gestation, pre-eclampsia, original magnification x 400; scale bar, 50 µm). The signals were detected in the nuclei of vascular endothelial cells (arrows) and syncytiotrophoblasts (arrowheads) in the chorionic villi. B) Immunostaining of IDO in a placenta (39 w gestation, normotensive pregnancy, original magnification x400; scale bar, 50 µm). Prominent staining is apparent in the cytoplasm of vascular endothelial cells (arrows) as well as syncytiotrophoblasts (arrowheads) in the chorionic villi.
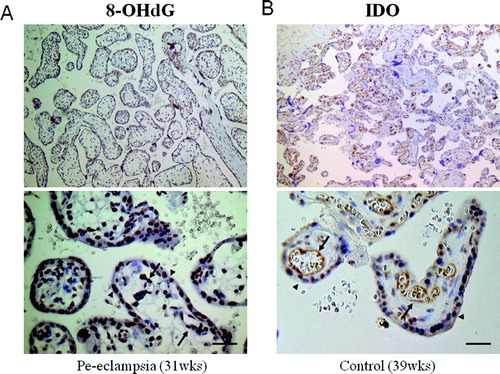
Figure 3. Correlation between the 8-OHdG and IDO enzymatic activity levels in the placenta. Regression lines are shown with correlation coefficients (r) and P values. Correlations were determined for the total subject cohort (solid line) and again separately for normotensive (circles, chain line) and pre-eclamptic subjects (triangles, dashed line). A significant inverse correlation was found between the placental 8-OHdG and IDO activity for both the total cohort (r = -0.621, P = 0.0003) and the separate cohorts (r = -0.712, P < 0.001; r = -0.591, P= 0.009, respectively).
Table 1. Clinical parameters of the study groups.