Figures & data
Table 1. Serum level of E2 (mean ± SD) after i.c.v. injection of ghrelin in rats during the estrus cycle.
Table 2. Serum level of P4 (mean ± SD) after i.c.v. injection of ghrelin in rats during the estrus cycle.
Figure 1. A) Levels of ERβ mRNA in the ovary after i.c.v. injection of ghrelin during the estrus cycle. The RNA levels during proestrus, estrus, metestrus, and diestrus are compared to the saline control following ghrelin administration. B) Expression of PRA+B mRNA in the ovary after i.c.v. injection of ghrelin in rats during the estrus cycle. *indicates significant difference between control and ghrelin injected group (P < 0.05)
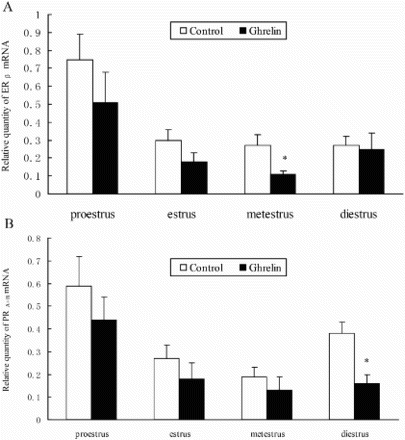
Table 3. Real-time PCR primer and size of the amplification products of target genes (ERβ,PRA+B) and housekeeping (β- actin).