520
Views
9
CrossRef citations to date
0
Altmetric
RESEARCH COMMUNICATION

Possible functions of adrenomedullin from the seminal fluid in the female reproductive tract of the rat

, , &
Pages 306-312 | Received 19 Oct 2011, Accepted 28 Mar 2012, Published online: 18 Jun 2012

Figures & data

Figure 1.  ADM gene expression and peptide level in male accessory sex glands. Gene expression level of ADM (A) and ADM peptide levels in the secretion (C) were highest in ventral prostate. Tissue, while little was secreted out ADM peptide was highest in seminal vesicle (B) among all the glands, while little was secreted out (C). ADM: adrenomedullin; *P < 0.01, vs. ventral prostate, #P < 0.01, vs. coagulating glands, Kruskal Wallis test; data presented as Mean ±SEM; N = 8 for tissue, N = 5 for the secretion
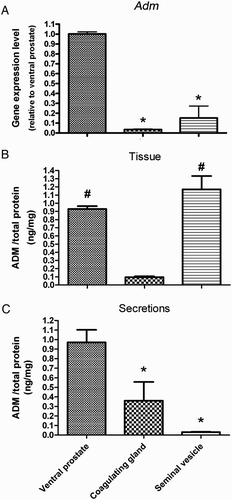
Figure 1.  ADM gene expression and peptide level in male accessory sex glands. Gene expression level of ADM (A) and ADM peptide levels in the secretion (C) were highest in ventral prostate. Tissue, while little was secreted out ADM peptide was highest in seminal vesicle (B) among all the glands, while little was secreted out (C). ADM: adrenomedullin; *P < 0.01, vs. ventral prostate, #P < 0.01, vs. coagulating glands, Kruskal Wallis test; data presented as Mean ±SEM; N = 8 for tissue, N = 5 for the secretion

Figure 2.  Cytokine mRNA expression levels in uterus tissue treated with different dosages of ADM for 4 hours in vitro. TNFα (A) and IL-6 (C) gene expression remained unchanged after treatment with ADM while IL-1β gene expression decreased significantly (B). ADM: adrenomedullin; TNF: tissue necrosis factor; IL: interleukin; P < 0.05, Newman-Keuls Multiple post test; data presented as Mean ±SEM; N = 5.
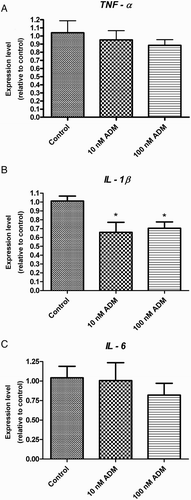
Figure 2.  Cytokine mRNA expression levels in uterus tissue treated with different dosages of ADM for 4 hours in vitro. TNFα (A) and IL-6 (C) gene expression remained unchanged after treatment with ADM while IL-1β gene expression decreased significantly (B). ADM: adrenomedullin; TNF: tissue necrosis factor; IL: interleukin; P < 0.05, Newman-Keuls Multiple post test; data presented as Mean ±SEM; N = 5.

Figure 3.  Percentage changes of cytokines in the culture medium after treatment with ADM for 4 hours in vitro. TNF α (A) and IL-6 (C) secretion was significantly decreased after treatment with ADM (*P < 0.05 vs. control, #P < 0.01 vs. control, +P < 0.01 vs. 10 nM ADM, Newman-Keuls Multiple post test). There was no difference in the IL-1β secretion (B) after ADM treatment. ADM: adrenomedullin; TNF: tissue necrosis factor; IL: interleukin; data were presented as Mean ±SEM; N = 9.
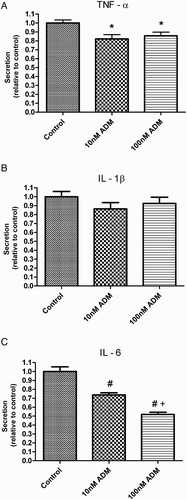
Figure 3.  Percentage changes of cytokines in the culture medium after treatment with ADM for 4 hours in vitro. TNF α (A) and IL-6 (C) secretion was significantly decreased after treatment with ADM (*P < 0.05 vs. control, #P < 0.01 vs. control, +P < 0.01 vs. 10 nM ADM, Newman-Keuls Multiple post test). There was no difference in the IL-1β secretion (B) after ADM treatment. ADM: adrenomedullin; TNF: tissue necrosis factor; IL: interleukin; data were presented as Mean ±SEM; N = 9.

Figure 4.  Number of leukocytes and macrophages in post coital (pc) uterus segment at different treatment groups. The number of leukocytes (A) and macrophages (B) were lower at 24 hpc than that at 1.5 hpc (*P < 0.01, LSD test).Infusion with the ADM receptor blocker decreased the number of the leukocytesand macrophages at 24 hpc (#P < 0.05, LSD test). ADM: adrenomedull in; data were presented as Mean ±SEM; N = 10.
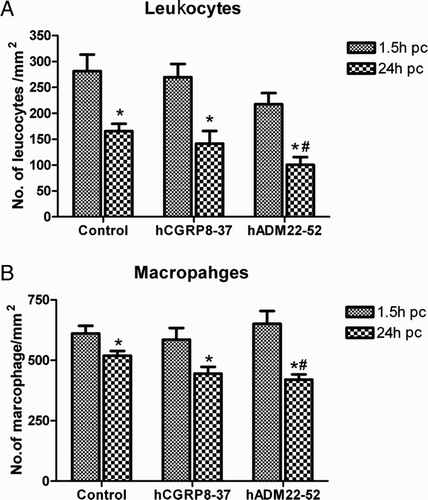
Figure 4.  Number of leukocytes and macrophages in post coital (pc) uterus segment at different treatment groups. The number of leukocytes (A) and macrophages (B) were lower at 24 hpc than that at 1.5 hpc (*P < 0.01, LSD test).Infusion with the ADM receptor blocker decreased the number of the leukocytesand macrophages at 24 hpc (#P < 0.05, LSD test). ADM: adrenomedull in; data were presented as Mean ±SEM; N = 10.

Figure 5.  ROS/DAPI fluorescence intensity ratios in isolated uterine epithelial cells treated for 2 hours in vitro. ADM significantly decreased the ROS level in the endometrial epithelial cells (A) (#P < 0.01 vs. control, one way ANOVA with Newman-Keuls multiple post test). ROS level in the epithelial cells decreased after post coital uterine fluid treatment (B). ROS: reactive oxygen species; ADM: adrenomedullin; (*P < 0.05 vs. control, one way ANOVA with Newman-Keuls multiple post test); N = 7.
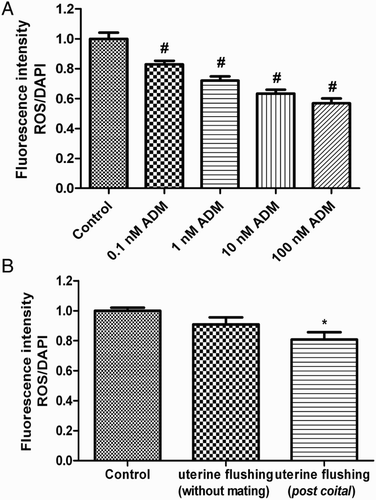
Figure 5.  ROS/DAPI fluorescence intensity ratios in isolated uterine epithelial cells treated for 2 hours in vitro. ADM significantly decreased the ROS level in the endometrial epithelial cells (A) (#P < 0.01 vs. control, one way ANOVA with Newman-Keuls multiple post test). ROS level in the epithelial cells decreased after post coital uterine fluid treatment (B). ROS: reactive oxygen species; ADM: adrenomedullin; (*P < 0.05 vs. control, one way ANOVA with Newman-Keuls multiple post test); N = 7.

Table 1. Primers for amplification of genes using real time PCR.

Reprints and Corporate Permissions

Please note: Selecting permissions does not provide access to the full text of the article, please see our help page How do I view content?

To request a reprint or corporate permissions for this article, please click on the relevant link below:

Academic Permissions

Please note: Selecting permissions does not provide access to the full text of the article, please see our help page How do I view content?

Obtain permissions instantly via Rightslink by clicking on the button below:

If you are unable to obtain permissions via Rightslink, please complete and submit this Permissions form. For more information, please visit our Permissions help page.