Figures & data
Table 1. Sperm parameters of raw semen, 50%, and 90% gradient separated semen sample.
Figure 1. Box plot distribution of percent high DNA staining (% HDS) cells from original semen, lower and upper gradient layers. The lower layer showed significantly (p < 0.0001) lower % HDS cells compared to upper layer. The box plot displays the 25th percentile, median, and 75th percentile. The circle represents outlier. The horizontal lines outside the box display minimum and maximum value.
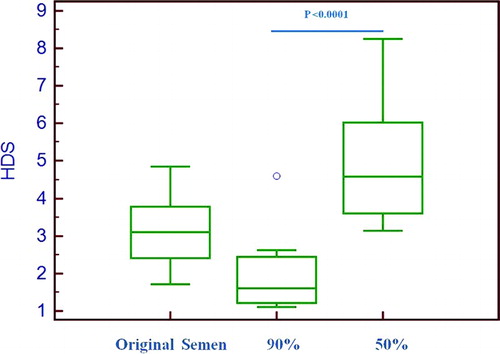
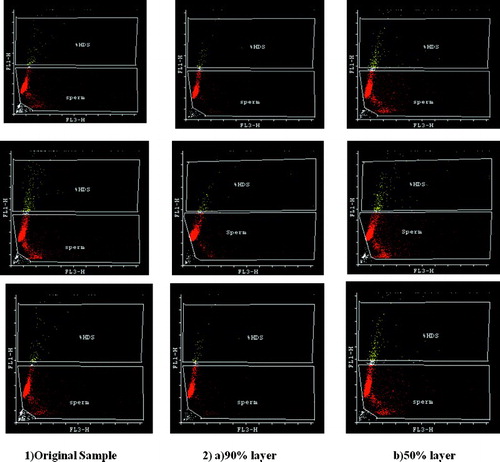
Figure 2. The sperm chromatin structure assay (SCSA) representative flow cytograms gated for sperm and high DNA stainability cells (HDS) from: 1) Original semen showing larger sperm population shifted towards X-axis (fragmented DNA) and 2) Density gradient separated: a) 90% layer showing less number of sperm population towards X-axis and b) 50% layer semen showing large number of sperm shifted towards X-axis.