Figures & data
Figure 1. Morphological appearance of granulosa cells under phase contrast microscope. A1, B1, and C1) all phase contrast images are captured in 20X magnification and corresponding scanning electron microscopy images (A2, B2, and C2,individual GC) in the three groups. Group A represents endometriosis; Group B represents PCOS; and Group C represents controls. GC: granulosa cells.
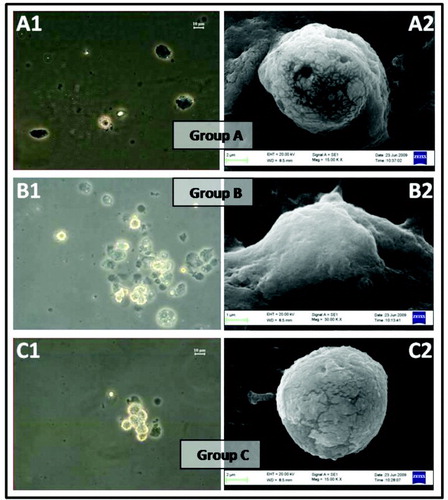
Table 1. Granulosa cell and oocyte characteristics in women undergoing IVF.
Table 2. Changes in ROS, MMP, DNA fragmentation, and IVF outcome parameters in GC obtained from women with endometriosis (Group A) and PCOS (Group B) and compared with tubal factor infertility (controls; Group C).
Figure 2. Flow cytometric histogram plot analysis has shown increased population in green (FL-1) channel indicates the generation of intracellular ROS (DCF-DA positive population) in GC of (A) endometriosis group, (B) PCOS group, and (C) control group. ROS: reactive oxygen species; GC: granulosa cells.
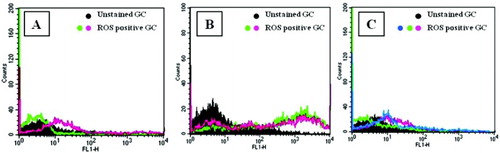
Figure 3. Flow cytometric dot plot analysis of mitochondrial membrane potential (∆Ψ) in GC as shown increased cells with reduced JC-1 fluorescence in the FL-2 (LR) channel in (A) endometriosis group, (B) PCOS group, and (C) control group. GC: granulosa cells.
Figure 4. Granulosa cells phase contrast (Group A, B, and C), and DNA damaged TUNEL positive cells as shown in fluorescent microscopy (A1) Group A; (B1) Group B; (C1) Group C. Further, phase contrast images (D and E) and fluorescent microscopic images (D1 and E1) were positive and negative controls, respectively, used for TUNEL assay.
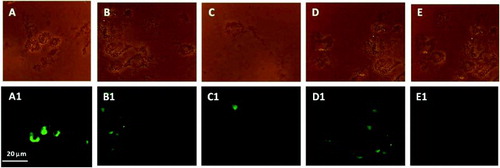
Figure 5. Percentage of mature oocyte formation rate (Grade III) and viable embryos formation rate (Grade I and II) in three groups. *P values were statistically significant (p < 0.05)