Figures & data
Figure 1. Study design. The animals were divided into placebo and test groups. The effect of CTX was assessed as a function of both dose and age of exposure. Animals were euthanized and tissue was harvested and examined.
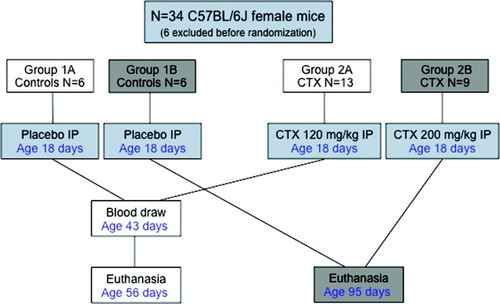
Table 1. BMI, femur length and weight, uterine and ovarian weight, means and confidence intervals (95% CI) in the control and CTX-exposed groups.
Table 2. Follicle stimulating hormone (FSH) means and confidence intervals (95% CI) in controls and the three mouse groups identified by the FSH cut-off values.
Table 3. Femur length and weight, uterine and ovarian weight, means and confidence intervals (95% CI) in the three groups identified by the FSH cut-off values.