Figures & data
Figure 1. Separating X and Y- bearing human sperm. When separating human sperm according to DNA content using Dyecycle™ Vybrant® Violet a strongly labeled sperm population was visible (A, elipse), but when samples were scanned according to fluorescence intensity only one peak was visible, showing no distinct subpopulations clearly definable by DNA content (B). If the extremes of this peak were gated (defined in B) sperm subpopulations could be obtained enriched in either Y (green spots) or X (red spots) bearing chromosomes, depending on whether the ascending (lower DNA content; C) or descending (higher DNA content; D) arm of the peak was selected, respectively. Panels C and D are representative FISH images, with DAPI (blue) used as a nuclear counterstain. Results with DRAQ5®were essentially identical (data not shown).
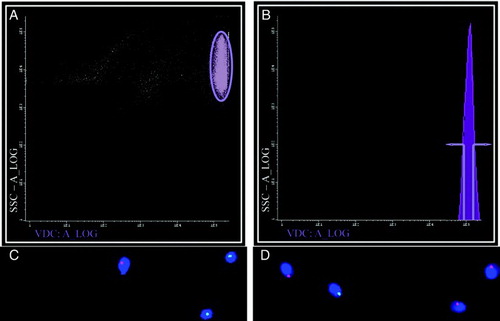
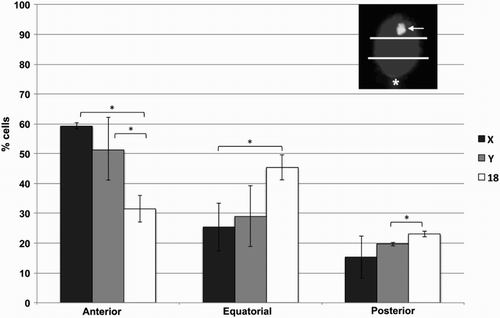
Figure 2. Chromosome positions in sorted human sperm. Human sperm were sorted according to DNA content and analyzed by fluorescence in situ hybridization (FISH) using probes for chromosomes X, Y, and 18. For localization purposes, and as shown in an example in the top right corner, the sperm head was divided into three equal quadrants (anterior, equatorial, posterior), with the tail insertion (asterisk) used as a landmark for the posterior side, and the localization of the FISH spot (arrow) classified accordingly. A total of 2,739 spermatozoa were evaluated, from seven distinct samples, and percentages calculated for each sample. Error bars represent standard deviation. *statistically significant differences (p < 0.05)