Figures & data
Figure 1. Flow diagram of sperm sample processing. Semen samples were classified as liquefied storage (L) or pelleted storage (P); for each storage, the samples were divided into two aliquots after initial cell counting and purified by either PureSperm (PS) or somatic cell lysis buffer (SCLB) methods. Final cell count determined the cell loss after purification; equal amount of cells were used as cell input for RNA isolation. Next, equal amount isolated RNA from each sample was applied as input for RNA-Seq library preparation; the libraries were deep sequenced for 50 cycles paired-end; the sequencing reads were demultiplexed, and short reads were aligned to human reference genome. Finally the alignment results were analyzed. The effect of sample storage and sperm purification methods to RNA profiling was evaluated.
Table 1. Cell recovery and yield of RNA from PS and SCLB purification methods.
Table S1. The number of sperm from each sample (in million cells)
Figure 2. Distribution of RNA-seq fragment sizes of 16 samples. Fragment sizes for each paired-end sequencing library were inferred from the separation of read pairs, which were mapped to the human reference genome using novoalign. It is clear that the average RNA fragments from samples purified by Pure Sperm (Blue and Green) is longer than that from SCLB (Red and Orange). P: pelleted storage; L: liquefied storage; PS: PureSperm purification; SCLB: somatic cell lysis buffer purification.
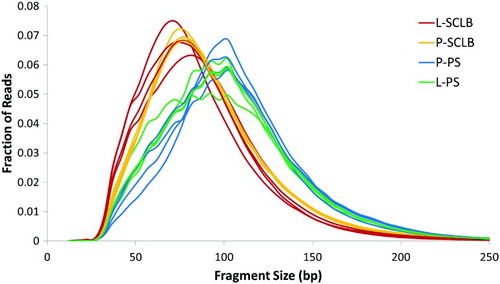
Table S2. RNA-seq statistics summary
Table 2. Reads mapped to mitochondria genome and 12S, 16S rRNA.
Figure 3. Unsupervised clustering of the four storage / purifcation methods. In each sample, the transcript profile generated from four methods were clustered. The Y-axis is the 1 - Pearson correlation coefficient. S1 ∼ S4: samples from four subjects; P: pelleted storage; L: liquefied storage; PS: PureSperm purification; SCLB: somatic cell lysis buffer purification.
Figure 4. Number of stable transcript pairs as a function of different criteria combination. The Y-axis is the number of stable transcript pairs obtained. In Panel A, the X-axis is Pearson correlation coefficient (Pcc); in Panel B, the X-axis is Coefficient of Variation (CofV); in Panel C, the X-axis is FPKM (fragments per kilobase of exon per million fragments mapped) values. A stable pair also needs to satisfy the following criteria: In panel A, CofV ≤ 0.2, FPKM ≥ 1; in panel B, Pcc ≥ 0.9, FPKM ≥ 1; and in panel C, Pcc ≥ 0.9, CofV ≤ 0.2. The Spearman correlation coefficient = 1 for the stable pairs in all three panels.
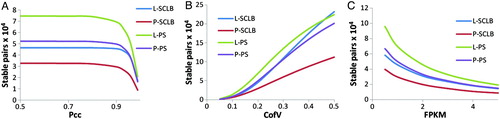
Figure 5. The distribution of reads mapping to gene RPS4X, which was generated from UCSC genome browser by uploading the corresponding short read positions. The blue arrow indicates the transcript 5' to 3' orientation. In Gene RPS4X, the thicker rectangles indicate the exons, the thinner rectangles at two ends indicate 5' UTR and 3' UTR. The number of reads corresponding to each base position is represented on the vertical axis. S1 ∼ S4: samples from four subjects; P: pelleted storage; L: liquefied storage; PS: PureSperm purification; SCLB: somatic cell lysis buffer purification
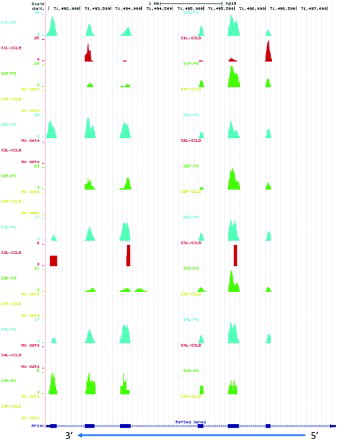
Figure S1. PCR assessment of DNA contamination and RNA integrity. A. Isolated RNAs and two human genomic cDNA samples were used as template. B. The synthesized cDNAs were used as template. The primer pair spans the PRM1 intron. S1∼S4 are the samples from four subjects; ‘P’ denotes pelleted storage. ‘L’ denotes liquefied storage; PS denotes PureSperm purification and SCLB is somatic cell lysis buffer purification; HG denotes human genome DNA; Ctrl denotes negative control.
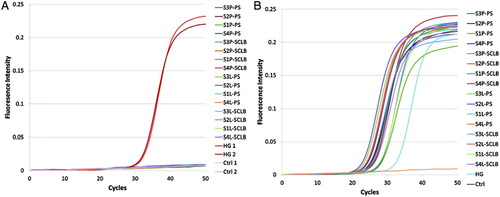
Figure S2. Distribution of reads mapped to mitochondrial genome. The scale for each sample is based on the maximum read count with the displayed region. In the mitochondrial genome, the coordinate of 12S rRNA is 648 – 1,601 and 16S rRNA is 1,671 – 3,229. S1∼S4 are the samples from four subjects; ‘P’ denotes pelleted storage. ‘L’ denotes liquefied storage; PS denotes PureSperm purification and SCLB is somatic cell lysis buffer purification.
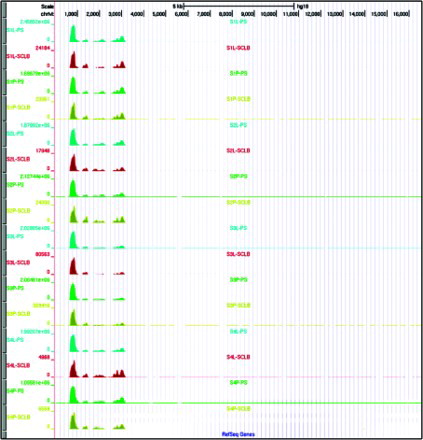
Figure S3. Unsupervised clustering by subjects. In each method, the transcript profile generated from four subjects were clustered. The Y-axis is the 1 - Pearson correlation coefficient. Panel A indicates SCLB purification from liquefied storage (L) samples; Panel B indicates SCLB purification from pelleted storage (P) samples; Panel C indicates PureSperm purification from liquefied storage (L) samples; and Panel D indicate PureSperm purification from pelleted storage (P) samples.
Figure S4. Number of stable transcript pairs as a function of different criteria. The short reads uniquely aligned to reference genome without mitochondrial sequence were used as input to calculate each gene's FPKM values. The Y-axis is the number of stable transcript pairs. The X-axis is: Pcc in panel A, Cofv in panel B; and FPKM in panel C. The other criteria are also required for stable transcripts identification: In panel A, CofV≤0.2, FPKM≥1; in panel B, Pcc≥0.9, FPKM≥1; in panel C, Pcc≥0.9, CofV≤0.2. The Spearman correlation coefficient=1 for the stable pairs in all three panels.
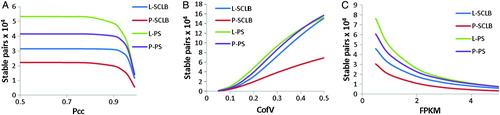
Table 3. Preferentially isolated genes in PS groups over SCLB groups.
Table 4. FPKM values of markers in each sperm sample.