Figures & data
Figure 1. Comparative electron microscopic pictures of human (A) and horse (B) prostasomes. Both human and horse prostasomes displayed prostasomes of various sizes. The horse prostasomes were somewhat smaller than the human prostasomes. Note the difference in magnification. Both prostasome types typically demonstrated electron dense and electron lucid vesicles generally surrounded by a classical bilayered membrane (arrows).
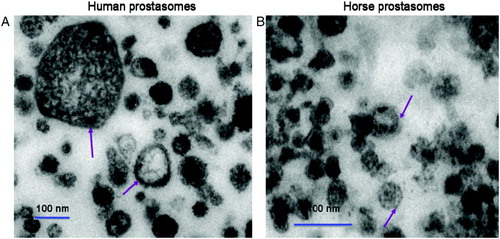
Table 1. Membrane fatty acid composition of human and stallion prostasomes.
Figure 2. SDS-PAGE of human prostasomes, horse prostasomes from five individual horses, and pooled horse prostasomes. Lane 1 was loaded with pooled human prostasomes. Lanes 2, 3, 4, 5, and 6 were loaded with prostasomes from individual horses; A, L, NW, O, and B. Lanes 7 and 8 were loaded with two different pools of horse prostasomes. The three bands around 98 kDa (see arrows), containing the characteristic proteins (CD10, CD13, and CD 26) for human prostasomes, appeared in all lanes. Proteins in the gel were disclosed by Coomassie staining. Lanes (1-8) in the right insert show the pattern of proteins > 98 kDa using the more sensitive silver staining.
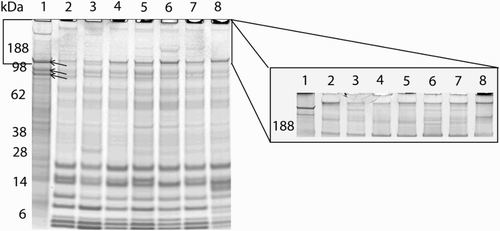
Figure 3. A comparative survey of 2D-separated proteins from human and horse prostasomes. The separations were performed in two dimensions, first a horizontal isoelectric separation followed by a vertical molecular weight separation. Prostasomal proteins from horse (bottom) displayed several marked proteins in the lower molecular weight bands (analyzed by Maldi-MS), not seen in the corresponding 2D of human prostasomal proteins (top).
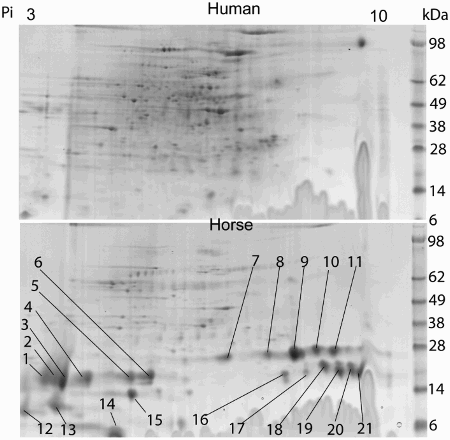
Table 2. Identified proteins in stallion prostasomes (Equus caballus).
Table 3. Compilation of exosome-related proteins identified in both horse and human prostasomes by either mass spectrometry or immunoblotting.