Figures & data
Figure 1. The ovaries exposed to molybdenum (Mo) at 20 mg/L (B) and 40 mg/L (C) exhibited the obvious hyperemia (black arrows), compared to the control group (A) (white arrows).
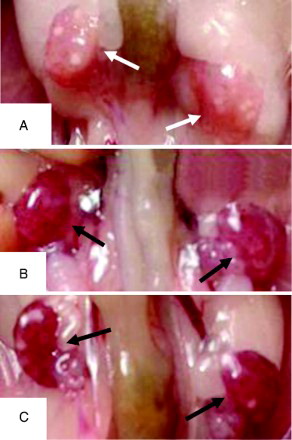
Figure 2. Morphological images of M II oocytes (×400). Compared to the control (A), the morphological abnormalities of M II oocytes were observed in mice exposed to molybdenum at ≥20 mg/L, such as no first polar body (B), distorted cytoplasm (C), transformative zona pellucida and excessive vacuolization (D), shrunken cytoplasm (E), and centrally severe granulation (F).
Table 1. Effects of molybdenum exposure on ovary parameters and M II oocyte morphology.
Table 2. Effects of molybdenum exposure on the levels of SOD, GPx, and MDA in ovaries.
Figure 3. Transmission electron microscopic images of the intra-ovarian oocytes (A-C) and the granulosa cells (D-F) in ovaries. Compared to the control (C, F, ×40,000), the mitochondrial vacuolization (A; ×5,000) and the swollen mitochondria with distorted cristae (B; ×40,000) in ovarian oocytes, and the mitochondrial vacuolization in granulosa cells (D, E; ×10,000) were observed in the 20 mg/L (A, D) and 40 mg/L (B, E) group. The arrow indicated the zona pellucida in A, and the arrows or cycle indicated the mitochondria in B-F.